全文HTML
-
改革开放以来,中国经济始终保持较高速度的增长,经济总量不断跨上新台阶,已成为全球第二大经济体,创造了经济持续增长的奇迹。然而,在中国经济高速增长的背后是以牺牲环境、资源为代价的粗放型经济增长方式,在面对环境污染、资源匮乏的情况下如何实现经济可持续发展成为目前亟待解决的问题。特别是2008年金融危机以来,中国经济增长由过去两位数的高速增长逐渐转变为中高速增长。在金融危机之后以美国、日本为首的发达国家及时调整发展战略,加快对新能源、节能环保、生物科技等新兴产业的布局以抢占未来经济发展的制高点。为实现经济的发展方式转变,我国开始部署培育发展战略性新兴产业,早在2010年国务院就正式发布《关于加快培育和发展战略性新兴产业的决定》,明确我国的战略性新兴产业为节能环保、新能源、新材料、新能源汽车、新一代信息技术、生物、高端装备制造七大产业,并提出中长期发展目标。但值得注意的是我国工业化的任务尚未完成,目前正处于工业化后期,传统产业占国民经济比重较大,且有待进一步改造升级,这一现实国情决定了我国当前必然面临着战略性新兴产业的培育发展和传统产业改造升级的双重任务[1-3]。然而在双重任务的现实背景下,我国要实现经济的高质量增长动力从何而来?经济增长的本质是数量积累与质量提升有机协调的过程[4],在此过程中产业协调发展与经济增长具有密切的关联。那么在我国面临双重任务的压力下,战略性新兴产业与传统产业协调发展水平如何?其又是通过何种渠道确保经济高质量增长?
产业协调发展以产业结构的高级化和合理化为目标,从整体协调角度审视经济增长,是我国经济新常态下经济增长的主要动力之一[5-6]。关于产业协调发展国内外专家学者进行了较为深入的研究,且大多以新兴产业与传统产业为研究对象。Porter的研究认为高新技术产业发展的关键在于传统产业[7]。Osaka从新的视角研究传统产业,发现台湾的纺织业既是传统产业,又是高新技术产业,并进一步指出传统产业与高新技术产业之间存在着相互作用、相互影响的关系[8]。Howard研究了新兴产业的“聚集兴起”,认为通过在传统产业中应用高新技术,会产生新的分工,从而从传统产业中裂变出新的产业[9]。我国学者胡晓鹏和李庆科则以长三角地区为研究对象,从产业共生的角度研究生产性服务业与制造业之间的关系,并归纳长三角地区两大产业的共生关系差异的原因[10]。同样,刘书瀚等利用中国投入产出数据,采用投入产出分析法研究两者之间的关联关系,发现这两者之间存在关联关系但是较弱[11]。以培育和发展战略性新兴产业和改造升级传统产业的双重任务为背景,梁威构建了耦合协调度评价指标体系测算两类产业的耦合协调度,并进一步分析各地区耦合协调度较低的原因[12]。
然而产业协调发展究竟对经济增长影响到底如何?部分学者研究了产业协调发展对经济增长的影响。如李志强等运用产业耦合协调度模型与面板数据模型实证研究了产业协调度水平对区域经济的影响,得出产业协调度水平对区域经济增长具有显著的拉动作用[13]。杜传忠等将制造业与生产服务业耦合协调度作为自变量引入到制造业竞争力分析中,研究发现两类产业的耦合协调度提升确实能够提高京津冀和长三角经济圈制造业的竞争力,有利于区域经济发展[14]。随着研究的逐步深入,一些学者开始关注产业结构升级对经济增长的影响。如干春晖等在测度产业结构合理化与高级化的基础上,通过构建关于产业结构变迁与经济增长的计量模型,实证分析两者对经济增长的影响,认为在产业结构变迁的过程中对经济增长存在阶段性特征[15]。
综上可见,国内外的学者对产业协调发展的研究已较为成熟,但对于产业协调发展如何对经济增长起作用,特别是在我国面临培育战略性新兴产业和改造升级传统产业的双重任务下,战略性新兴产业与传统产业协调发展如何作用于经济高质量增长的影响,还有待深入分析。
-
产业结构合理化是产业之间协调水平提高和关联程度加深的动态过程[14],传统产业与战略性新兴产业协调发展本就是产业结构合理化的题中应有之意。而产业协调发展如何促进产业结构合理化,关键在于要素配置问题。一般认为,产业协调会增强要素流动性,改变产业内要素间配比结构,进而提高要素在三次产业之间以及各产业内部的配置效率[16]。我国经济转型过程中要素低效配置问题普遍存在,造成产业间以及产业内部结构不合理。产业之间通过协调发展利用技术进步偏向性影响要素投入结构,引导资本或劳动要素在产业部门重新分配,使要素流向回报率较高的产业,实现要素在产业间的优化配置。特别是在我国面临培育和发展战略性新兴产业和改造升级传统产业的双重任务下,通过协调战略性新兴产业与传统产业之间的关系,将战略性新兴产业的先进技术充分运用到传统产业的生产过程;同时,传统产业利用其资金优势以保证战略性新兴产业技术突破,由此形成良好循环,并最终提高产业结构合理化水平[1]。
产业结构合理化首先通过产业结构的存量转换与增量发展对产业逆向选择所带来的部分缺陷进行修正,由此形成经济稳定增长的内在动力[13],其次在资源合理配置的基础上提高产业生产效率,促进经济增长[17],具体表现为生产要素因产业结构逐步合理化而加快从低生产率部门向高生产率部门转移,通过资源的再配置加速新兴行业的发展,而新兴行业的生产效率与技术创新能力通常表现出较高水平,从而有利于提高经济增长率[18]。基于此,本文提出如下假设:
H1:产业协调发展提高产业结构合理化水平,进而促进经济增长。
-
产业结构高级化是一国国民经济的产业结构由以劳动密集型产业为主的低级结构,向以知识、技术密集型产业为主的高级结构调整和转变的过程及趋势。新兴产业与传统产业发展相互影响与制约,两者之间的协调发展催生新的分工,为传统产业中裂变新的产业提供条件,提高产业结构高级化水平。首先,产业协调发展通过产业关联进而影响产业结构高级化发展水平,尤其是处于产业链上下游相关联的产业,通过向前一体化与向后一体化策略,战略性新兴产业的技术与传统产业融合发展推动传统产业的转型升级[19]。其次,产业协调发展通过产业融合推动产业结构向高级化方向发展,产业融合过程本质上是产业结构不断从低级形态向高级形态、由低级水平向高级水平演进的过程。随着产业协调发展的快速发展,使得产业分立走向产业融合最终促成产业向高级化方向发展[20]。再者,产业协调发展改变传统产业单独演进的形式,促进产业共生发展[21],主要表现为传统产业在自身演进过程中不断渗透新技术,例如“互联网+”行动计划的推行使传统产业逐步向高级化形态演进。
产业结构高级化程度是理解发展中国家与发达国家经济发展区别的重要变量,也是后发国家加快经济发展的关键[22]。党的十九大报告强调,推动创新驱动和产业结构升级对中国经济稳定增长至关重要。实际上,经济发展本就是一个技术、产业不断创新和结构升级的变化过程[23]。随着经济不断增长,产业结构高级化表现为三次产业比重沿着第一、二、三产业的顺序不断上升[24]。在这种变化趋势过程中生产效率不断提升,促使经济增长率得到显著提高。因此,产业结构高级化程度提升对经济增长起着至关重要作用[25]。基于此,本文提出如下假设:
H2:产业协调发展提高产业结构高级化水平,从而促进经济增长。
(一). 产业协调发展、产业结构合理化与经济增长
(二). 产业协调发展、产业结构高级化与经济增长
-
耦合原是物理学概念,表示两个或两个以上系统之间通过各种相互作用形成对彼此之间影响的现象;耦合度则是用来描述各系统之间相互作用、彼此影响的程度,后来逐渐用于地理、经济等研究领域。本文在借鉴梁威的研究基础上,建立战略性新兴产业与传统产业耦合评价指标体系,测算两类产业耦合协调发展水平[26]。通过参考已有研究并结合数据可得性,本文采用高新技术产业数据近似代替战略性新兴产业数据,而关于传统产业选取则依据《国民经济行业分类》(GB/T 4754-2011)的分类标准,在两位行业代码的工业行业统计中剔除高技术产业所覆盖的行业,将煤炭开采和洗选业、食品制造业、纺织业等24个行业作为传统行业的代表。具体评价指标体系如下:
经济增长是在较长的时间跨度内,一个国家人均产出(或人均收入)水平的持续增加。但当经济发展到一定程度时,研究重点不再仅是经济增长的速度问题,更重要是“经济增长质量”与经济增长是否具有可持续性的问题[27]。因此,本文将经济增长效应具体划分为“水平效应”“增长效应”以及“绿色效应”,并分别用人均GDP对数、全要素生产率、绿色全要素生产率来衡量,并考虑到经济增长滞后性引入被解释变量滞后一阶建立动态面板模型。模型设定如下:
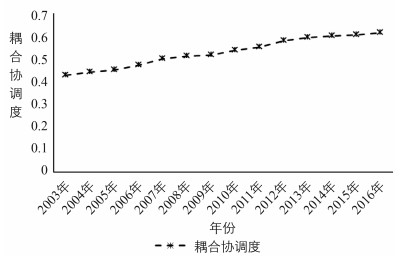
其中,i代表省份;t为年份;ξ为残差项;lnY为经济增长“水平效应”,用人均GDP的对数表示;TFP为经济增长的“增长效应”,用Malmquist生产率指数衡量;GTFP为经济增长的“绿色效应”,由绿色全要素生产率表示;CD为战略性新兴产业与传统产业耦合协调度;control为控制变量,包括要素投入、对外开放水平、研发能力、政府规模、金融发展等变量。在检验产业协调发展的经济增长效应基础上,由耦合协调度模型测算得出两类产业的耦合协调度,从平均变化趋势来看我国战略性新兴产业与传统产业的耦合协调度呈上升趋势,两类产业的耦合协调度从2003年的0.469上升到2016年的0.627,增长33.7%。这说明我国战略性新兴产业与传统产业之间的资源要素良性互动逐渐增强。但就目前而言,根据王瑜炜对于耦合协调度的分类方法,两类产业协调度尚处于初级协调阶段,还未能实现阶段的跨越[28]。具体耦合协调度等级划分与测算结果如下表、下图所示:
根据逻辑分析和数据的可得性,本文建立回归模型检验经济增长背后的理论机制:
其中,ER代表产业结构合理化,借鉴干春晖等的做法,采用泰尔指数来度量产业结构合理化水平[13];ES表示产业结构高级化,大多数研究基于克拉克定理采用非农业产值比重来衡量。但需要指出,发达国家或地区的发展经验显示,“经济结构服务化”是产业结构升级的重要特征,因此,本文参考于斌斌方法,采用第三产业与第二产业的产值之比来反映产业结构高级化水平[18];其他变量含义同前文所述。
-
被解释变量、核心解释变量以及中间变量已在上文做出了较为详细的说明,这里不再赘述。以下将对控制变量进行详细说明。
1.控制变量
① 要素投入
要素投入作为经济增长的基础,对经济增长具有重要作用。Gregory和Lin研究认为,在1978-1998年间物质资本和劳动力投入对经济中国经济贡献率分别为62%、10%,由此得出物质资本存量和劳动力投入对经济增长的作用较为突出。本文参考Gregory和Lin的研究将各省份历年就业人口占总人口比重(labor)和物质资本存量的对数(capital)作为要素投入指标,其中物质资本存量采用张军的计算方法得到[29]。
② 对外开放水平
对外贸易和经济增长之间的关系一直是学术界关注的热点问题,通过对外贸易和投资有助于技术改进,增强本国创新能力,从而促进经济快速发展。基于此,采用各地区进出口总额占地区总产值的比重(open)来衡量对外开放水平。
③ 研发能力
研发能力大小在一定程度上代表一个国家或地区创新水平的高低,对经济的增长具有重要的推动作用。其中专利的授权数(patent)表示一定时期内某地区研发能力大小[30],因此将各地区专利授权数取对数作为衡量研发能力的标准。
④ 金融发展
Levine认为金融发展与经济发展相伴而生,金融功能的完善能够促进金融中介与经济增长的良性发展。随着金融市场的不断发展,为经济主体提供金融服务促进了资源优化配置,降低了企业的融资成本[31]。因此本文借鉴文献常用的做法将各地区历年贷款余额占地区总产值的比重(finance)作为衡量金融发展水平的标准。
⑤ 政府规模
政府在经济增长的过程中扮演了较为重要角色,通过纠正市场的不完全性,为市场经济的健康发展提供后盾保障。鉴于政府对经济增长的重要作用,本文参考姚先国做法,把地方财政支出占地区总产值的比重(government)作为衡量政府规模的标准[32]。
2.数据来源与统计性描述
① 数据来源
本文以中国30个省(市、区)作为研究对象(西藏地区数据缺失严重,因此未作为本文的研究对象),选取2003-2016年省级面板数据。数据主要来源于《中国统计年鉴》《中国工业统计年鉴》《中国高技术产业统计年鉴》《中国科技统计年鉴》以及各省、市、区《统计年鉴》,对于少部分缺失数据,采用趋势拟合估算得到。
② 统计性描述
表 3汇总了因变量、自变量、中间变量和控制变量的构造方法及数据特征,同时为解决异方差问题,数据处理多采用取对数、取比值的方法。具体见表 3。
(一). 模型设计
(二). 变量与数据
-
1.面板数据单位根检验
由于有些时间序列数据并不存在直接的关联但又表现出共同的变化趋势,其数据的回归结果同样表现出较高的拟合度,但却没有实际意义。为避免此类伪回归,在面板数据模型回归之前有必要对面板数据进行平稳性检验,本文运用相同单位根LLC检验和不同根Fisher-ADF检验数据平稳性。由检验结果可看出各变量水平序列平稳,检验结果如表 4所示:
2.面板数据协整检验
通过单位根检验可发现,所检验的变量均为平稳序列,故在此进行面板协整检验,协整检验结果显示,五个被解释变量与各解释变量之间存在长期稳定的均衡关系,因此可以进一步对模型进行回归分析。检验结果如表 5所示:
-
系统GMM估计在随机误差项分布、异方差、自相关方面的约束条件较为宽松,可以通过寻找合适的工具变量降低模型存在内生性问题,得到有效估计参数。为降低模型中存在的内生性问题,本文借鉴Arellano和Blundell的系统GMM方法对动态面板数据模型进行回归分析[33-34]。此外用AR(1)、AR(2)和Sargan进行自相关与过度识别检验以保证模型整体有效性。表 6分别给出产业协调发展对经济的“水平效应”、“增长效应”以及“绿色效应”影响的动态面板回归结果。
表 6系统GMM回归的AR(1)分别在1%、5%、5%的显著水平上显著,而AR(2)则不显著,并且对应的Sargan检验也均不显著,由此表明本文选取的工具变量和滞后阶数是合适的,不能拒绝工具变量联合有效性的原假设,进而说明模型的整体可靠性与有效性。从表 6中(1)-(3)列可直接观察到产业协调发展对经济增长的三种效应均通过5%的显著性水平检验,但就回归系数符号而言,存在较为明显的差别。
具体来看,两类产业的协调发展对经济增长的“水平效应”回归系数为负值,而对经济增长的“增长效应”与“绿色效应”回归系数为正值。可能原因是,其一,就目前而言我国战略性新兴产业与传统产业耦合协调度还处于较低水平,还未凸显出对经济增长“水平效应”的拉动作用,只有当两类产业协调发展达到某一门槛时,才能对经济增长的“水平效应”产生积极影响;其二,战略性新兴产业与传统产业不同于一般意义上两种事物的协调发展,大部分战略性新兴产业由传统产业发展而来,在转型升级过程中可能存在短期成本上升问题,对经济发展造成一定负面影响;其三,经济增长的“增长效应”与“绿色效应”对两类产业协调发展的反映较为敏感,两类产业协调发展提高了资源利用效率,且战略性新兴产业的先进技术应用到传统产业生产经营当中减轻了后者生产行为对环境的影响,提高了传统产业经济绿色的生产效率。
-
上文检验了产业协调发展对经济增长三种效应的影响,以下部分重点对产生这些影响的背后机制进行检验,具体分为产业合理化与产业高级化两种渠道。本文采用检验机制的方法为:在前文产业协调发展对经济增长三种效应影响回归的基础上,进一步用产业合理化与产业高级化分别对产业协调发展进行回归,具体结果如表 7所示。
表 7中的模型(4)和模型(5)产业协调发展回归系数分别是-0.214和1.007,且分别通过5%和1%的显著性水平检验,表明两类产业协调发展促进了产业结构的合理化与高级化。产业结构合理化与高级化是经济增长的重要推动力,一方面,两类产业协调发展改变了产业内要素间配比结构、加快了产业融合,进而促进了产业结构合理化水平的提高,推动产业结构迈向高级化,最终对经济增长起到一定促进作用;另一方面,经济增长反过来又会对产业结构合理化与高级化产生影响,这种相互影响和反复循环凸显了两类产业协调发展对经济增长的推动作用。
-
为进一步检验模型稳定性,本文采用不同的计算方法测算产业结构合理化与高级化水平。首先采用结构偏离度衡量产业结构的合理化水平即:
式(6)中,Yi、Y、Li、L分别表示某地区第i产业产值、产业总产值、第i产业的从业人数、总从业人数。ER值越大,表明产业结构就越不合理;反之,则产业结构趋于合理化。而对于产业结构高级化则采用靖学青的方法[35],计算公式如下:
式(7)中,n表示某地区有n个产业,q(i)是将这些产业按高层次到低层次加以排序所得的比例。由表 8回归结果看,产业协调发展回归系数均未发生明显变化,表明实证结果具有一定稳健性。
(一). 面板数据单位根检验与协整检验
(二). 实证结果与分析
(三). 产业协调发展的经济增长效应机制检验
(四). 稳健性检验
-
本文采用2003-2016年省级面板数据,利用耦合协调度模型测算战略性新兴产业与传统产业耦合协调度作为两类产业协调发展度量指标,从理论论证与实证检验两个方面探讨了两类产业协调发展如何影响经济的增长。理论论证部分推演了产业协调发展对经济增长的实现路径,实证部分首先检验两类产业协调发展对经济增长的影响,其次从产业结构合理化与产业高级化两个角度探讨两类产业协调发展影响经济增长的内在机制。根据研究内容得出以下研究结论:(1)由耦合协调度模型测算得出两类产业的耦合协调度,从平均变化趋势来看我国战略性新兴产业与传统产业的耦合协调度呈上升趋势,两类产业的耦合协调度从2003年的0.469上升到2016年的0.627,增长33.7%,但尚处于初级协调阶段,还未能实现阶段的跨越。(2)两类产业协调发展提高了产业结构合理化与高级化水平,进而提升经济增长动力。(3)在控制要素投入、对外开放水平、研发能力等变量后,两类产业的协调发展在短期内对经济增长的“水平效应”具有负向影响,对经济增长的“增长效应”与“绿色效应”存在正向促进作用。
针对以上研究结论并结合理论分析,得出以下几点政策启示:(1)推动战略性新兴产业与传统产业协调发展。一方面,鼓励将战略性新兴产业中的先进技术应用到传统产业,以提高传统产业生产效率;另一方面,发挥传统企业的资金优势以满足战略性新兴产业技术创新需要。同时,深化行业体制改革,活跃要素,降低战略性新兴产业进入与退出门槛,促进战略性新兴产业与传统产业更好发展。(2)规划产业协调发展路径以优化产业结构。文章研究表明战略性新兴产业与传统产业的耦合协调通过提升产业高级化与合理化水平两个方面进而促进经济增长。因此,首先应进一步提高产业结构高级化与合理化水平,以保障我国经济高质量发展。产业结构合理化与高级化是经济增长的直接动力,通过不断提高战略性新兴产业与传统产业耦合协调发展水平以逐步优化产业结构,进而增强经济增长的动力。其次,我国在制定产业政策时不能制定“一刀切”政策,应根据客观经济事实制定相关产业政策,以避免出现政策与本地区实际情况不符问题,努力做到产业政策精准性。例如在欠发达地区主要可以增加要素投入培养本地区产业发展,而在有一定产业基础地区则要将重点放在促进产业结构升级上,使要素流向生产率高的部门,从而提高经济增长率。(3)建立完善产业创新体系。消费需求的转变催生战略性新兴产业兴起,同时也引发生产工艺与流程改变,对战略性新兴产业和传统行业提出更高的要求。科学技术对建立现代产业体系不言而喻,在经济发展方式转变的背景下,创新能力提高不仅是战略性新兴产业和传统产业发展的桥梁,也是经济增长质量提高的战略支撑。


 下载:
下载: