-
联合国政府间气候变化专门委员会(IPCC)第五次报告指出[1],全球平均气温在1971-2010年以0.09~0.13 ℃/10a升高,全球范围的冰川逐渐消退,温室气体的浓度也上升到了前所未有的水平,全球变暖导致水循环的加剧,进而可能导致极端降水事件的频发.
在全球变暖的背景下,我国增暖的趋势与北半球的增暖趋势大致相似[2],我国极端降水和极端温度事件的长期变化特征具有明显的区域性和局域性,年和季节尺度的极端冷暖指数均呈现出增加趋势[3].杨金虎等[4]指出中国年极端降水事件的主要空间异常模态为四川西南部、湖南、江淮北部、新疆西部、西藏与中国其他区域年极端降水的空间分布呈反向变化特征.胡豪然等[5]指出四川盆地汛期极端降水的发生频次与降水量分布有很大差异,由西向东呈阶梯状递减趋势.丁文荣[6]指出四川盆地中部是极端降水的频发区,而四川盆地北部山区则较少发生极端降水.
四川盆地地处高原大地形和东部平原的过渡带,气候差异较为明显,其气候变化具有独特的特点和规律,胡豪然等[5]采用相对阈值定义极端降水事件的方法研究过四川盆地汛期极端降水事件的变化,本文将通过相对阈值以及绝对阈值2种方法定义的7种极端降水指数较为全面地分析近55a汛期极端降水事件的长期变化规律[7],为四川省短期气候预测与防灾减灾提供一定的科学理论依据.
全文HTML
-
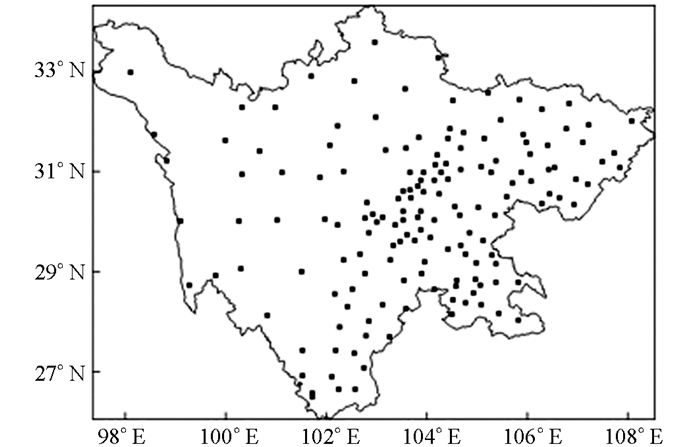
采用四川省气象信息中心经过严格质量控制及错误值订正的1961-2015年四川省156个气象台站逐日降水资料,气候平均值采用1981-2010年的平均值.四川省位于97-110°E,25-35°N范围内,站点分布如图 1所示.
采用世界气象组织推荐使用的极端天气气候事件监测指标中的7种极端降水指数,分别为降水总量、强降水、降水强度、降水百分率、1日最大降水量、连续5日最大降水量、暴雨日数[8].具体的指标如表 1所示.
本文将1961-2015年每年的逐日降水序列的第95个百分位的55a平均值定义为该站发生极端降水事件的绝对阈值[9],当某日降水量超过此阈值时,为该站发生了极端降水事件.将四川省156个台站每站逐日降水资料作为一个降水序列,把每站的降水序列按升序排列为
$ {x_1}, {x_2}, {x_3}, \ldots , {x_i}, \ldots , {x_n}$ ,当某个值小于或等于xi的概率为:式中:i为xi的序列号;n为降水序列的总长度,则p=95%所对应的xi的值为该站第95个百分位值[10].
此外,本文采用F检验方法检验1961-2015年极端降水事件的变化趋势是否稳定,采用低通滤波的方法[11]滤掉低频信号来研究四川省汛期极端降水指数的年代际变化趋势.通过滑动t检验方法[11]对近55a四川省汛期极端降水指数进行突变检验,通过相关系数[11]分析其极端降水指数间的相关性,采用小波分析方法[11]分析极端降水指数的周期振荡特征.
-
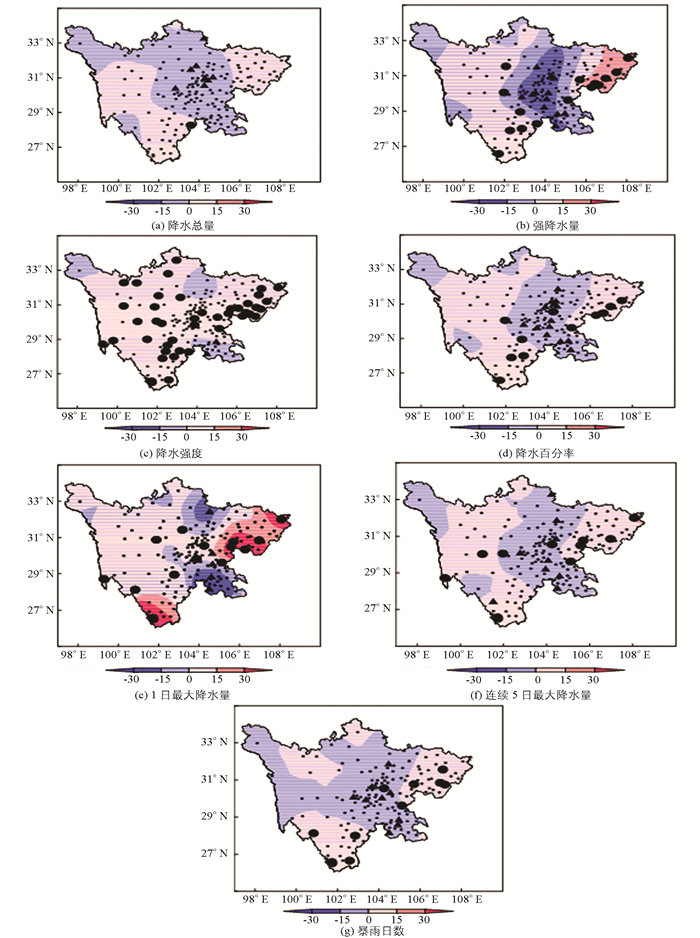
由1961-2015年四川省汛期极端降水指数的气候倾向率的空间分布可知(图 2a~2g),对于总降水量而言(图 2a),在川西及东北部地区主要呈增加趋势,在东部地区总降水量呈显著增加趋势,气候倾向率最大为32.5 mm/10a,通过0.05显著性检验的站数占总站数的1.9%,汛期总降水量在川中部地区、川西高原西北部、攀西地区南部主要呈减少趋势,在川中部地区减少最为显著,气候倾向率最大为-62.7 mm/10a,通过0.05显著性检验的站数占总站数的14.1%;汛期强降水量在川西绝大部分地区及川东北部地区呈增加趋势(图 2b),在东北部地区增加显著,气候倾向率最大为74.61 mm/10a,通过0.05显著性检验的站数占总站数的9.6%,在川中部地区呈显著减少趋势,最大气候倾向率为-46.4 mm/10a,通过0.05显著性检验的站数占总站数的7.7%;汛期降水强度在四川省绝大部分地区呈显著增加趋势(图 2c),最大气候倾向率为0.77 mm/d/10a,通过0.05显著性检验的站数占总站数的27.6%,在川西高原的西北部以及北部、南部少部分地区呈减少趋势,在南部地区减少趋势显著,气候倾向率最大为-0.74 mm/d/10a,通过0.05显著性检验的站数占总站数的1.3%;汛期降水百分率在川西部大部分以及东部地区呈增加趋势(图 2d),在攀西地区以及川东部少部分地区呈显著增加趋势,气候倾向率最大为2.75%/10a,通过0.05显著性检验的站数占总站数的7.0%,在川中部地区主要呈显著减少趋势,气候倾向率最大为-0.47%/10a,通过0.05显著性检验的站数占总站数的9.0%;汛期1日最大降水量在四川省大部分地区呈增加趋势(图 2e),在攀西地区南部以及川东部少部分地区增加显著,气候倾向率最大为226.57 mm/10a,通过0.05显著性检验的站数占总站数的9.6%,在川北部以及东南部主要呈显著减少趋势,气候倾向率最大为-107.8 mm/10a,通过0.05显著性检验的站数占总站数的3.2%;汛期连续5日最大降水量在川西大部分地区以及川东部地区呈增加趋势(图 2e),气候倾向率最大为33.70 mm/10a,通过0.05显著性检验的站数占总站数的7.1%,在川西高原北部以及川中部大部分地区呈减少趋势,在川东地区显著减少,气候倾向率最大为-17.35 mm/10a,通过0.05显著性检验的站数占总站数的5.8%;汛期暴雨日数在川西部大部分地区以及川东部地区呈增加趋势(图 2f),气候倾向率最大为0.8d/10a,通过0.05显著性检验的站数占总站数的7.1%,在川西高原北部以及攀西地区西部、川中部地区呈减少趋势,在川中部地区减少显著,气候倾向率最大为-0.6d/10a,通过0.05显著性检验的站数占总站数的5.8%.
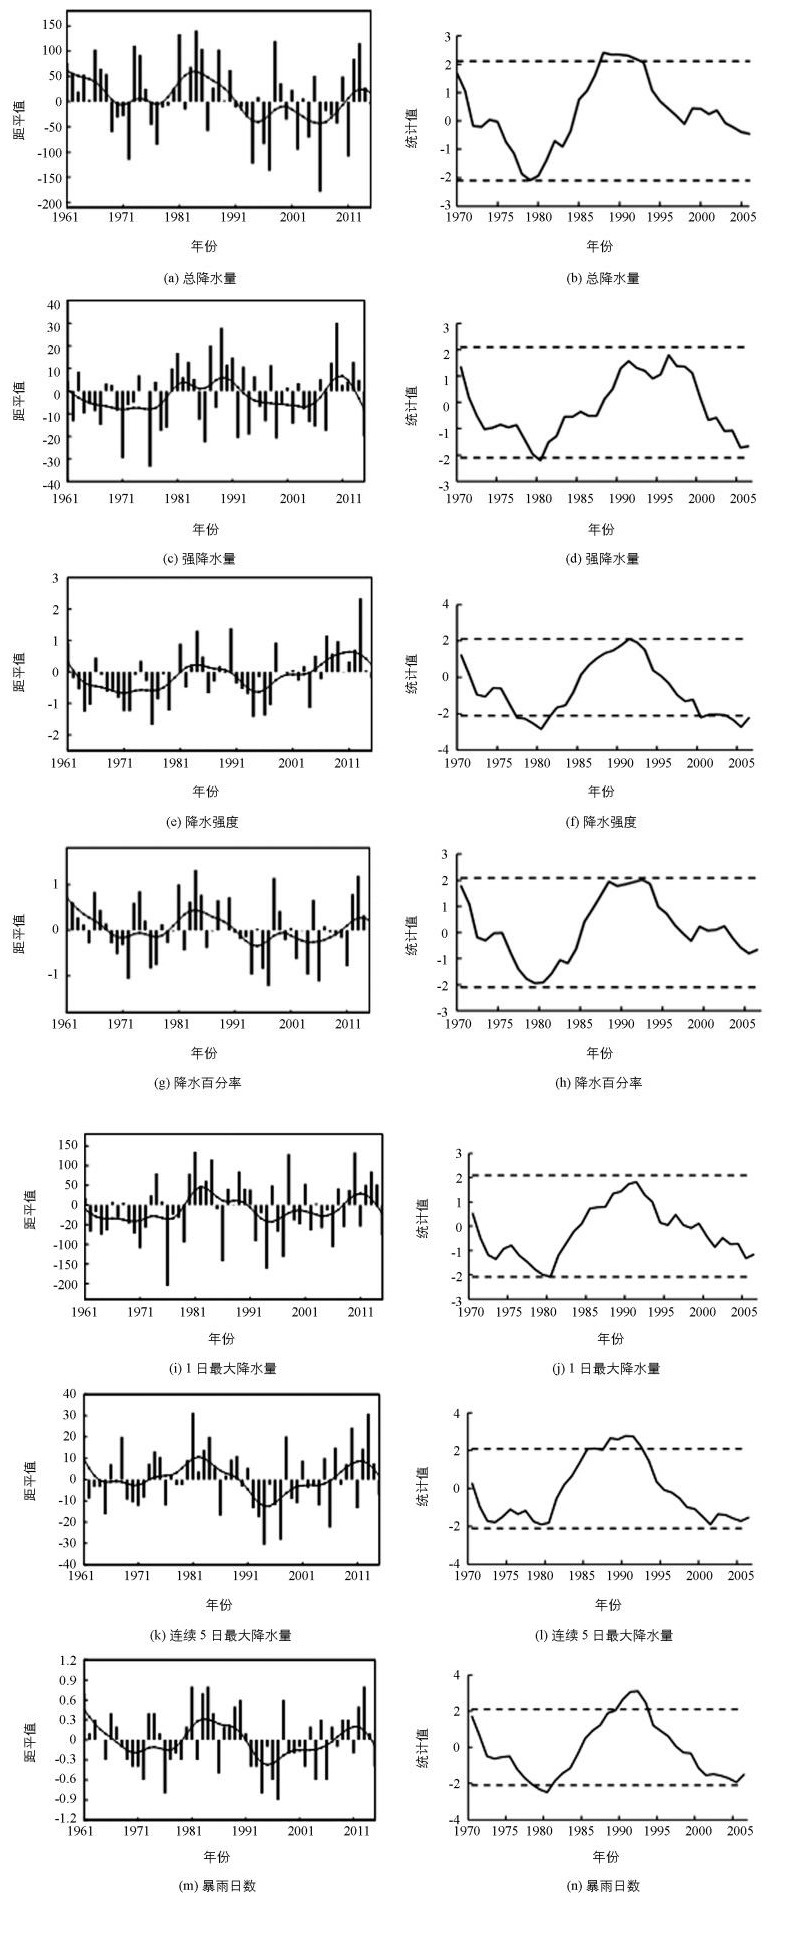
近55a四川省汛期降水总量呈显著下降趋势(图 3a),其气候倾向率为-9.73 m/10a,在0.25的检验水平上有统计学意义,在1961-1989年期间以正距平居多,为汛期降水总量偏多的时期,其余时期汛期降水总量偏少,1981,1985,1998年汛期降水总量异常偏多,1994,1997,2006年汛期降水总量异常偏少;由滑动t检验可知,汛期降水总量在1980年和1988年前后(在0.05的检验水平上有统计学意义)发生2次明显的转变,具有明显的年代际变化特征(图 3b).近55a四川省汛期强降水量呈增加的趋势(图 3c),气候倾向率为1.11 mm/10a.在1980-1989年、2010-2014年以正距平居多,表现为汛期强降水量偏多的时期,其余时期强降水量偏少,1989,2010年异常偏多,1971,1976年异常偏少;由滑动t检验可知,在1980年前后(在0.05的检验水平上有统计学意义)汛期强降水发生了一次明显的转折,具有明显的年代际特征(图 3d).近55a四川省汛期降水强度呈显著增加的趋势(图 3e),气候倾向率0.17 mm/d/10a,在0.01检验水平上有统计学意义.在21世纪初期以正距平居多,表现为汛期降水强度偏大的时期,其余时期降水强度偏小,在2013年汛期降水强度异常偏大,1976年汛期降水强度异常偏小;由滑动t检验可知,在1980年和1991年、2005年(均在0.05的检验水平上有统计学意义)前后,汛期降水强度发生了明显的转折,具有显著的年代际(图 3f).值得一提的是,近55a四川省汛期总降水量是明显减少的,但是降水强度却是明显增加的.近55a四川省汛期降水百分率呈减少趋势(图 3g),气候倾向率为-0.05/10a.在1980年以前以正距平居多,表现为汛期降水百分率偏大的时期,其余时期汛期降水百分率偏小. 1981,1984,1998,2013年汛期降水百分率异常偏大,1972,1997,2006年汛期降水百分率异常偏小;由滑动t检验可知,降水百分率在1992年前后(在0.05的检验水平上有统计学意义)发生了一次转变(图 3h).近55a四川省汛期日最大降水量呈增加趋势(图 3i),气候倾向率为6.96 d/10a.在1980年及2009年到2015年以正距平居多,表现为汛期日最大降水量偏多的时期,其余时期汛期1日最大降水量偏少,1981,1984,1998,2010年汛期1日最大降水量异常偏多,1976,1986,1994,1997年汛期日最大降水量异常偏少;由滑动t检验可知,汛期日最大降水量在1980年前后(在0.05的检验水平上有统计学意义)发生了一次转变(图 3j).近55a四川省汛期连续5日最大降水量呈增加趋势(图 3k),气候倾向率为0.21d /10a. 1961-1980年、2005年到2015年汛期连续5日最大降水量以正距平居多,表现为汛期连续5日最大降水量偏多的时期,其余时期则偏少,1981,2010,2013年汛期连续5日最大降水量异常偏多,1994,1997,2006年汛期连续5日最大降水量异常偏少;由滑动t检验可知,汛期连续5日最大降水量在1990年前后发生了一次明显的转变,年代际变化显著(图 3l).近55a四川省汛期暴雨日数呈减少趋势(图 3m),气候倾向率为-0.01d/10a. 1981-1989年、2010-2014年以正距平居多,表现为汛期暴雨日数偏多的时期,其余时期汛期暴雨日数偏少,1981,1983,1984,2013年汛期暴雨日数异常偏多,1976,1994,1997年汛期暴雨日数异常偏少;由滑动t检验可知,汛期暴雨日数在1980年和1992年前后(分别通过0.05和0.01显著性检验)发生了2次明显的转变,具有明显的年代际变化图(3n).
-
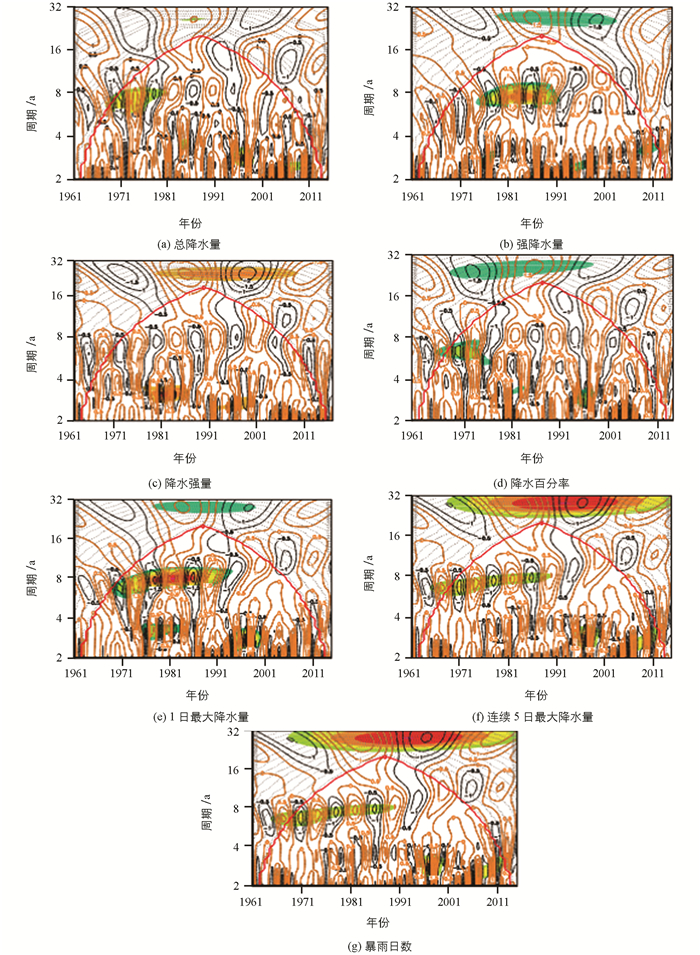
近55a四川省汛期降水总量存在准8a和3~4a左右的(图 4a),8a左右的周期振荡在1967-1980年明显,3~4a周期振荡在1995-1998年明显;汛期强降水量存在着准8a和3~4a的(图 4b),准8a周期振荡在1975-1990年明显,3~4a的周期振荡在1975-1998年和2005-2013年明显;汛期降水强度存在准8a和3~4a的周期(图 4c),3~4a左右的周期振荡在1975-1985年和1990-1998年明显;汛期降水百分率存在6~8a和3~4a的周期(图 4d),6~8a的周期振荡在1967-1976年明显,3~4a左右的周期振荡在1982-1984年以及1995-1998年明显;汛期1日最大降水量存在准8a以及3~4a的(图 4e),准8a的振荡周期在1970-1994年明显,3~4a的振荡周期在1975-1984年明显;汛期连续5日最大降水量存在着6~8a以及3~4a的(图 4f),6~8a周期振荡在1968-1990年明显,3~4a周期振荡在1995-2000年明显;汛期暴雨日数存在着6~8a以及3~4a的(图 4g),6~8a周期振荡在1968-1990年明显,3~4a周期振荡在1995-2000年明显.
-
1) 近55a四川省汛期降水总量、强降水量、降水百分率、连续5日最大降水量及暴雨日数均在川西绝大部分地区以及川东部地区呈增加趋势,在川中部地区呈减少趋势;降水强度及1日最大降水量在四川省绝大部分地区呈增加趋势.
2) 在时间变化上,汛期极端降水指数(强降水量、降水强度、降水百分率、1日最大降水量、连续5日最大降水量、暴雨日数)均对汛期降水总量的长期气候变化趋势具有一定的指示意义.
3) 四川省汛期各极端降水指数具有明显的周期振荡特征,降水总量、强降水及降水强度、日最大降水量、暴雨日数均存在准8a以及3~4a的短周期振荡;降水百分率以及连续5日最大降水量在年代变化上均具有6~8a和3~4a的短周期变化特征.
四川省汛期极端降水变化趋势具有明显的区域性差异特征,造成这种差异可能是由地形、环流等诸多因子共同作用的结果.首先,四川省地跨青藏高原、横断山脉、云贵高原、四川盆地等地貌单元,作为高原大地形及我国东部平原的过渡带,地势西高东低,由西北向东南倾斜,地形复杂多样,使得四川省具有复杂的气候,东部盆地属亚热带湿润气候,西部高原在高原大地形的作用下,以垂直气候带为主,从南部山地到北部高原,由亚热带演变到亚寒带,垂直方向上亚热带到永冻带的各种气候类型,这种地形造成的气候差异,可能是造成四川省汛期极端降水区域性差异的重要原因.
其次诸多环流因子(如海温、冰雪、副热带高压、季风等)的共同作用也是造成地汛期四川省极端降水差异的重要因素.四川省位于青藏高原东侧,诸多环流因子的变化均会对区域降水产生重要影响,海温的异常、冰雪覆盖的变化、副热带高压位置和强弱以及季风等的变化均会影响区域降水的发生.例如东亚夏季风减弱,使得四川盆地西部及北部地区降水明显减少.副热带高压位置偏西偏南的变化会有利于四川盆地东部夏季降水的发生,不利于四川盆地西部及北部地区夏季降水的发生[12].
另外,人类活动也是不容忽视的一个原因,随着中国经济的迅速发展,使得人类活动加剧,进而导致温室气体的增加,有可能将导致区域降水的次数减少,降水强度增加[12].
总之,造成四川省汛期降水变化的原因是相当复杂的,具体特征明显,本文只通过多个角度定性地探讨其可能的原因,在后续工作中会通过相关分析、合成分析以及数值模拟等方法进行定量的讨论.


 下载:
下载:


