全文HTML
-
党的十九大报告指出,深化金融体制改革,一方面要提高直接融资比重,促进多层次资本市场健康发展,另一方面要守住不发生系统性金融风险的底线。在过去的30年中,我国股票市场的总市值从1990年23.82亿增长到2022年初近90万亿,已成长为了世界第二大股票市场,市值规模仅次于美国市场。目前,沪深两市的上市公司数量已经超过了4600家。作为世界最大的股票市场之一,A股市场的系统性风险一直受到监管机构和投资者的广泛关注。基于均衡资产定价理论,风险总是与收益并存,超额收益是对于投资者承担相应的系统性风险的补偿。基于此,结合市场数据和金融学理论有效测算A股市场超额收益率,不但可以增强市场价格发现能力,还有助于实时监测市场整体系统性风险,具有丰富的理论内涵和实践价值。
从金融经济学理论角度出发,因子定价理论将风险资产的期望超额收益归因于资产的系统性风险暴露,从而使各类风险资产的期望收益率能够通过有限的因子暴露进行刻画,也解释了各类风险资产期望收益率之间的相关性特征。这一方面极大地便利了资产配置与组合管理,另一方面也使我们对风险资产收益率的决定逻辑有了更深入的认识。
因子模型成功与否的关键在于找到能有效解释风险资产超额收益率的因子指标。以股票为例,现有文献通常认为,因子变量对股票超额收益率的影响主要来自两个方面:一是投资该因子所承担的风险,二是风险溢价,也即对投资该因子所承担的风险的相应补偿。对于市场更在意的风险,投资者往往需要更高的预期超额收益率作为补偿。
从因子模型的发展历程来看,在经典的CAPM理论中,市场超额收益率是驱动个股超额收益率的唯一因子[1-3]。随后,研究者发现市场中还存在其他类型的系统性风险。如Fama和French综合前人研究发现,包含市场、规模与价值的三因子模型可以更有效地解释股票超额收益率的差异[4-5]。但由于市场本身的不完善,或因为研究者的认知不足,传统多因子模型或多或少地存在定价偏误。为了提高多因子模型的定价能力,学者们致力于寻找新的对股票超额收益率有解释力的因子指标。在过去的数十年里,各种新的定价因子层出不穷,迄今为止,海内外文献中提出的有效定价因子已多达百余个[6-7]。
虽然有效因子数量庞大,我们却不宜将所有因子同时纳入考量。一方面,根据传统资产定价理论,随机定价核是一个维度较低的随机变量[8]。因此面对高维度的因子集合,我们需要探究哪些因子包含更多的定价信息[6]。另一方面,根据有限注意力理论,投资者对资产进行估值时所考虑的风险因素是有限且稀疏的[9]。此外,从统计学和计量经济学的角度来看,维度过高的因子模型既难以进行准确的估计,容易造成样本内的过拟合,且不符合简要律(Law of Parsimony)。因此,如何从大量因子中筛选出真正有解释力的因子、实现模型的压缩,是因子“大数据”时代亟需解决的一个重要问题。
我国A股市场经过数十年的发展已逐步走向成熟,多因子模型也在国内学界和业界的研究和实践中得到越来越广泛的应用,被发现有效的定价因子不断涌现,针对A股市场的有效因子筛选的重要性日益凸显。与此同时,我国经济和金融结构在过去的数十年中经历了较大变迁,市场风格也有着较大的时变特性,但鲜有文献从多因子模型定价的角度讨论A股市场的风格变迁。因此,本文针对我国A股市场,创造性地提出“基于市值加权的自适应LASSO算法”,对A股市场进行了实时定价因子筛选。本文的研究意义体现在理论方法和实践两个角度。在方法创新方面,LASSO算法通过在目标函数中引入回归系数的一阶模作为惩罚项,最终同时实现了因子选择和参数估计。相对于普通LASSO算法,自适应LASSO算法采用了调整不同参数的惩罚权重这一改进思路[10]。本文设计的市值加权自适应LASSO算法则是传统自适应LASSO算法和以市值为权重的最小二乘法的结合,既能避免模型被过度压缩(Shrinkage),又能防止结果受到小市值股票的影响[11]。在此意义上,本文为因子筛选方法的研究提供了具有启发性的新思路。
从实践角度看,我国A股市场具有鲜明的发展中国家市场的特点,不同时期的市场风格差异较大,传统多因子模型的(样本外)定价表现往往差强人意。因此,我们需要根据A股市场的特点设计更科学、更有针对性的时变因子筛选方法。本文的实证分析结果表明:1)我国A股市场存在显著的风格变迁特性,不同时期的有效定价因子个数和具体定价因子有着显著差异;2)整体而言,在A股市场上平均最为有效的定价因子是市场因子、税收因子、市盈率因子、规模因子和速动因子;3)使用市值加权自适应LASSO算法的多因子模型能有效地从大量因子中筛选出关键因子,精准地识别A股市场的风格变迁,其样本外定价表现也显著更优。具体而言,基于市值加权自适应LASSO模型构建的多空组合在样本外的月度平均收益率为1.19%,夏普率为0.963 3,显著高于参照模型(包括WLS模型、PCA模型、普通LASSO模型与Elastic Net模型,下详)构建的多空组合。在此意义上,本文也为我国资本市场上的投资实践和市场监管提供了有力的新工具。
本文与现有文献的区别及边际贡献可概括为两点。第一,不同于以往中外文献大多直接使用公司特征预测我国个股超额收益率,或者使用因子模型解释历史平均收益率的做法,本文针对A股市场构建了具有广泛用途的资产定价因子库,并首次同时针对多个因子采用了多因子模型来预测个股收益率。第二,在此基础上,为了找到更符合A股市场实时特征的定价模型,本文创造性地基于市值加权自适应LASSO方法,率先在多因子模型框架内对不同时期主导A股市场风格的定价因子进行了识别,并对基于不同模型构造的投资组合进行了样本外检验。我们不但发现A股有着明显的风格变迁特点,相较于使用WLS方法、PCA、普通LASSO与Elastic Net方法的定价模型,使用市值加权自适应LASSO方法的定价模型具有更强的样本外收益预测能力,基于市值加权自适应LASSO模型构造的投资组合也比基于WLS模型、PCA模型、普通LASSO模型与Elastic Net模型所构造的投资组合在短、中以及长期内有着更高、更稳健的样本外收益。我们也发现市值加权自适应LASSO模型所构建的投资组合在短期内的投资表现显著高于中期投资表现,也高于长期投资表现,这也说明基于本文所提出的预测模型的预测效力在短期预测上更有优势。
后文的安排如下:第二部分对多因子模型和变量选择的主要文献进行综述,第三部分介绍本文使用的模型与算法,第四部分为因子构建和实证分析,第五部分总结。
-
因子模型方面,自二十世纪90年代以来,Fama & French使用个股的市值和账面市值比划分投资组合,据此构造出市值和价值因子,这两个新因子与原有的市场因子一同构成著名的Fama-French三因子定价模型[5]。Carhart在Fama-French三因子模型的基础上,使用股票前一年的超额收益率构造了一个描述股票动量效应的新因子[13]。Fama & French则在其三因子模型的基础上引入盈利和投资两个新因子,构造出Fama-French五因子模型[14]。类似地,Hou等使用市场、市值、盈利和投资因子构造出四因子的q-因子模型[11]。Novy-Marx使用贝塔、账面市值比、动量和毛利与总资产之比构造出另一个四因子模型[14]。Daniel & Hirshleifer & Sun则基于非理性行为构造了短期和长期两个行为金融因子,并结合市场因子构造出新的三因子模型[15]。在多因子模型蓬勃发展的数十年里,定价因子或公司特征的种类不断增加。已有文献不但总结出百余个有效的定价因子或公司特征[11, 16],还使用了近百个因子对个股超额收益率进行了样本外预测[17-19]。
LASSO算法方面,Rapach & Strauss & Zhou使用LASSO方法研究了美国股票收益率与国际股票收益率之间的关系[20]。Goto & Xu使用LASSO方法重新估计了均值-方差框架中的方差协方差矩阵[21]。Chinco & Clark‐Joseph & Ye从解释市场异象(market anomalies)的角度来选择LASSO方法中的最优惩罚参数[22]。Freyberger& Neuhierl& Weber从公司特征出发,使用Group-Adaptive-LASSO方法在众多公司特征中挑选可以预测个股收益率的(少数)公司特征[19]。
目前,国内资产定价文献着重于考察西方主流因子模型对A股市场的适用性,专门针对A股市场的多因子模型和相应的因子压缩文献尚处于起步阶段。潘莉和徐建国对A股市场的股票收益横截面差异进行了分析,指出市场回报率、股票市值和市盈率是影响A股收益率的主要因素[23]。李倩和梅婷研究了Fama-French三因子模型在A股市场不同时期的解释能力,发现全样本内市场效应、规模效应和价值效应较为显著[24]。韩立岩、蔡立新和尹力博针对A股市场构建了一个绿色效率因子,提出了一个四因子模型[25];李少育、张滕和尚玉皇则检验了A股市场上的市场摩擦对特质性风险定价的影响[26]。这些研究纳入考虑的因子数目较为有限,部分涉及因子筛选的分析也以子集法为主,目前几乎没有中文文献对高维情况下的因子筛选问题进行深入探讨。
从统计学习的角度来看,从大量的资产定价因子中寻找数目有限的有效因子,本质上是一个变量选择(Variable Selection)问题。统计学中处理这一问题的方法主要有三类。第一类是子集法,也即逐个遍历待选变量的子集,分别进行回归,并根据一定的标准(如AIC、BIC等)确定最优子集。这一方法耗时较长、复杂度高,在变量数目较大的情况下不易使用。第二类是降维法,通过将原有变量集投影到低维空间来减少变量的个数,典型的算法有主成分分析法(PCA、PLS)和线性判别分析法(LDA)等。第三类是压缩法,该方法一般通过(一阶模)惩罚回归的方式实现,即求解一个目标函数为损失函数加惩罚函数的优化问题,当变量增加、模型复杂度提高时,损失函数值降低而惩罚函数值升高,最优解即为最佳的变量组合。本文设计的因子筛选方法属于第三类方法。
与本文最为相近的文献有两篇,Lewellen直接使用多个维度的公司特征对个股收益率进行预测,并设计了样本外投资组合以考察模型的预测能力[17]。Jiang & Tang & Zhou则尝试使用多种数据降维技术(如PCA、PLS)对公司特征维度上的信息进行压缩,据以预测A股市场上的个股收益率[27]。本文与上述文献的不同之处在于,本文更重视系统性风险暴露而非公司特征,为此设计并使用的市值加权自适应LASSO方法,能有效筛选出有效市场有效因子:基于本文模型所设计的股票多空组合相对于基准模型也有更高的样本外收益率和更稳定的投资表现。因而,本文在有效定价因子的同时,也识别了A股市场上不同时期能有效参与定价的系统性风险。
-
假设时点t上的股票总数为N,因子总数为K,多因子资产定价模型可表示为:
其中,rt是N×1的向量,其中每个元素代表单支股票在时点t上的超额收益率;Xt-1是N×K的矩阵,其第i行代表第i只股票分别在K个因子上的风险暴露,即K维的beta,也被称为因子载荷(Factor Loading);θt是K×1的向量,是K个因子在时点t上的溢价,也被称为因子收益(Factor Return);
$\epsilon_t $ 是N×1的向量,是N支股票的特质(idiosyncratic)收益率,也即股票超额收益率中不能被因子解释的部分。在实证分析中,rt是可观测的变量,θt是待估计参数,$\epsilon_t $ 是扰动项,正式回归前首先需要估计作为解释变量的因子载荷矩阵Xt-1。我们参考Fama & French的做法[14],在构造出各因子的收益率时间序列后按以下步骤估计个股的因子载荷:第一步,对每个因子,在每个时点上,按照(与因子对应)公司特征取值的高低将股票排序,选取排名居前的股票和靠后的股票构造多空组合,称之为因子模拟组合(mimicking portfolio);第二步,计算每个因子模拟组合在每个时点上的收益率
$\widetilde{f}_{k s} $ (下标k指代因子,s指代时点),作为该时点上该因子的收益率的近似;第三步,对每支股票,使用时点t之前该股票的历史收益率对因子模拟组合的历史收益率进行如下线性回归,所得系数即为该股票在时点t上的因子载荷:我们按以上步骤估计出的因子载荷具有相同的量纲与合理的经济学含义,能反映出个股收益率对因子收益率的敏感性。
-
利用历史数据估计出因子载荷矩阵Xt-1后,下一步是在横截面上将个股的超额收益率rt回归至Xt-1,所得系数即是相应因子收益θt的估计值。本文设计的市值加权自适应LASSO算法是两种方法的结合,一是传统自适应LASSO算法[10],二是以市值为权重的最小二乘法[11],以下分别加以介绍。
相对于普通LASSO算法,传统自适应LASSO算法采用了调整不同参数的惩罚权重这一改进思路。为了节省空间,以下讨论在不影响理解的情况下省去了变量的时间下标。传统自适应LASSO算法将目标函数设为:
其中
$ \hat{w}_k$ 通常被设为|θk, ols|-γ,θk, ols是对因子模型进行OLS回归所得到的系数估计值。$ \hat{w}_k$ 是传统自适应LASSO算法区别于普通LASSO算法的关键所在。当将$ \hat{w}_k$ 一律设为1时,传统自适应LASSO算法便退化为普通LASSO算法。直观上不难理解传统自适应LASSO算法的思路:当某一解释变量的OLS系数估计值的绝对值较大(从而$ \hat{w}_k$ 较小)时,算法倾向于保留该变量,因此降低其惩罚项的权重,以防止模型的过度压缩[10]。相对于普通LASSO算法,传统自适应LASSO算法能在更一般的条件下生成对参数的一致估计,并满足统计学上的Oracle性质:一是筛选出真实有效变量的概率趋近于1,二是参数估计具有无偏和渐进正态的性质。但是,为了减轻小市值股票的影响以保证结果的稳健性,本文参考Hou等的做法,将传统自适应LASSO算法中的OLS回归替换为以市值为权重的加权最小二乘法(WLS)回归,由此得到的便是市值加权自适应LASSO算法[11],其目标函数为:
其中
$ \hat{w}_k$ 被设为|θk, wls|-γ,θk, wls是对因子模型进行以市值为权重的WLS回归所得到的系数估计值;MVt是N×1的向量,罗列了N支股票在时点t上的市值,MVt代表N支股票在时点t上的总市值,⊙为Hadamard乘积符号。不难发现,当N支股票市值相等时,市值加权自适应LASSO算法便等同于传统自适应LASSO算法。
一. 多因子模型
二. 市值加权自适应LASSO算法
-
本文使用A股市场2005-2020年所有个股的月度复权收盘价、月度流通市值和年度财务报表来构造因子指标,最终得到47个因子2008-2020年各月份的收益率序列。相关数据来自国内金融数据终端Wind和金融数据接口Tushare Pro。2005年股权分置改革以前,我国资本市场的定价机制存在严重扭曲[28],流通股股东与非流通股股东的利益存在相当的不一致,因此本文仅着眼于2005年之后的A股市场。
在后文构造投资组合的过程中,为了保证投资组合的可复刻性和流动性,我们在股票池中剔除了风险警示(“ST”)股票、上市120天内的次新股以及停牌退市股票。为了避免使用未来信息导致虚高的回测结果,我们没有在全样本范围内剔除股票,而是对股票池进行实时筛选:当月被戴帽“ST”、仍在上市120天内的次新股和停牌退市股票被剔除出当月的股票池,而摘帽“ST”、上市超过120天的次新股和复牌的股票则被纳入当月的股票池。
-
在因子选择方面,由于A股的历史数据较少,为了使用有限的样本更合理地估计因子载荷,本文总结了文献中的常用因子和公司特征[11, 18],结合中美会计准则的差异,构造出47个具有不同意义的因子,并汇总于表 1中:
① 资产有形程度为(0.715*总应收款项+0.547*存货+0.535*固定资产+现金和短期投资)/总资产。本文将总应收款项定义为应收账款、应收票据、其他应收款、应收利息、应收红利的总和[29]。
② 自由现金流量因子为企业自由现金流量与公司股东权益合计(不含少数股东权益)的比值。企业自由现金流量是息税折旧摊销前利润(EBITDA)扣去所得税、资本性支出和营运资本增加[11]。
-
在得到个股的各个公司特征后,我们根据公司特征取值的高低对个股进行排序,然后通过买入高排名股票、卖空低排名股票构造出相应的因子模拟组合,并按照以下方法分类计算因子模拟组合的收益率
$\left(\widetilde{f}_{k t}\right) $ :第一,对于市场因子,我们直接用各月份中证A股指数的收益率减去上月末中债1月期国债的到期收益率(月度化),以此作为模拟组合的收益率。
第二,对于规模因子,我们在每年6月末将全市场股票按流通市值从高到低排列,跟踪买入小市值(排名后50%)并卖空大市值股票(排名前50%)的因子模拟组合,并在每个月记录该模拟组合的收益率,直到下一年的6月末再次更新组合。
第三,对于其他按年度更新组合的因子(通常为与财务信息相关的基本面因子),我们在每年6月末根据前一年的年报数据构造因子指标,并将股票按指标取值从高到低排列,将排名前20%和后20%的股票组分别记为H与L。与此同时,我们将所有股票按流通市值进行排列,分为小市值和大市值两组,分别记为S与B,由此得到HS、HB、LS和LB四个组合(这一双重划分法可剔除规模因子对其他因子的影响[13])。模拟组合每月的收益率按如下公式计算:
其中rHS、rHB、rLS和rLB分别代表四个组合按流通市值加权的收益率。理论上,部分因子应该是指标取值越高、收益率越低,对这些因子来说,按以上公式计算得到的期望收益率可能为负,但不会影响后续的回归和变量选择。此外,对于股本因子,由于双重分组后数据有效的股票数目过少,我们直接将HS组与HB组合并,将LS组与LB组合并。
第四,对于动量和反转因子等按月度更新组合的因子,构造的方法与第三种类似,只不过因子模拟组合需要每月更新。在每月底按照因子指标进行排序后,同样结合流通市值分为四组,并按上述方法计算下一月的模拟组合收益率。
本文所得因子模拟组合收益率的描述性统计结果如表 2所示:
由描述性统计结果可见,A股市场整体的波动较大,大多数因子模拟组合的超额收益率均不显著,仅规模因子、现金因子和换手波动因子在5%的水平下具有显著超额收益,这与相关国内实证资产定价研究的结果基本相符。
一. 样本选取与数据处理
二. 因子构造
三. 因子模拟组合收益率计算
-
在基于历史数据估算出因子模拟组合的收益率后,本文采用Fama & French的时序回归方法估计因子载荷。对于每支股票,我们选取各时点前60个月的个股月收益率对因子模拟组合收益率进行回归,回归所得系数即为该股票在该时点的因子载荷。当窗口期内的月收益率有效观测值个数少于40时,我们将该股票从该时点的样本中剔除。事实上,进行时序回归时所用的窗口期如果过长,则不利于反映真实因子载荷的动态变化,还会减少样本容量;如果过短则很难对大量因子的参数进行合理估计。
-
得到个股因子载荷后,我们将个股未来一个月的收益率回归到其因子载荷上以估计因子收益。我们同时尝试了三种模型,分别是(1)以市值为权重的自适应LASSO模型(以下统称为“市值加权自适应LASSO模型”)、(2)以市值为权重的普通LASSO模型(以下简称为“普通LASSO模型”)和(3)包含所有因子的、以市值为权重的线性回归模型(以下简称为“WLS模型”)。第一个模型是本文的核心模型,后两者是参照模型。
关于自适应回归中的超参数λ与γ,简单起见,我们直接将γ设为1,这类似于Breiman提出的非负Garrote估计法[30],对于λ的选择则使用贝叶斯信息准则[10]。具体来说,首先取第一个满足所有系数估计量均为0的λ作为待选参数的上界λ,然后取λ的10%作为待选参数的下界λ,再在λ与λ间划出100等分,使用每个分位点的λ进行压缩估计。最后,在得到100组系数估计量后,根据贝叶斯信息准则选取最优的超参数λ:
其中
$ \hat{y}$ 为因变量估计值,n为样本数量,$d f(\hat{y}) $ 为模型自由度。在使用自适应LASSO和普通LASSO方法进行压缩估计后,我们再基于每个横截面上筛选出的有效因子,使用个股收益率对有效因子的载荷进行WLS回归,并以回归系数作为有效因子当期收益率的最终估计结果。对于压缩方法未筛选出的因子(亦即无效因子),当期收益率记为0。
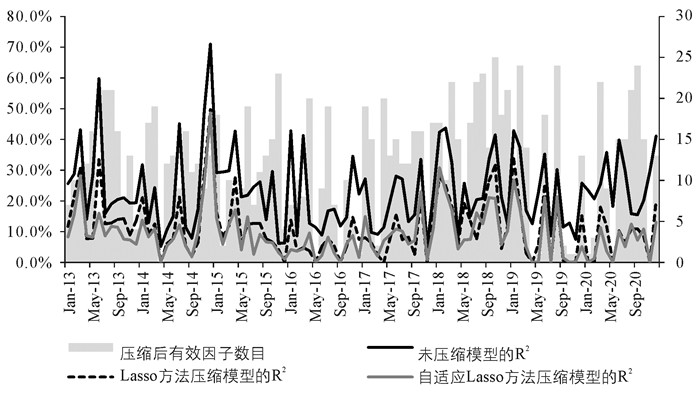
图 1展示了市值加权自适应LASSO回归的部分结果,包括各期的调整R2(左轴)与有效因子的数目(右轴)。作为对比,我们将WLS回归和普通LASSO回归的各期调整R2一并显示于图中,我们可以发现A股市场有着明显的时变特性,有效定价因子的个数随着时间变化有着显著波动。
从样本内拟合的角度看,市值加权自适应LASSO回归与WLS回归的R2存在约12个百分点的差距,与普通LASSO回归的R2则不存在明显差距。WLS回归由于未对参数进行压缩,容易产生较大的样本内R2,这实际上是一种过拟合的表现;而市值加权自适应LASSO方法筛选出的有效因子虽然数量有限,却仍能在相当程度上解释股票收益率的样本内差异。
此外,从图 1中我们不难发现,在部分时期,即使将所有因子纳入回归,所得的R2也比较低,因此压缩后很多因子没有得到保留。例如,2015年上半年A股市场受场外融资等因素影响出现泡沫,部分月份使用47个因子回归所得的R2尚不足10%,在这些月份中市值加权自适应LASSO方法得到的系数估计值大多为0,即仅少数几个因子有效。我们发现,整体而言,A股市场有效定价因子的个数和具体有效定价因子存在着显著时序差异。
平均来看,市值加权自适应LASSO方法在本文考察时间范围内识别出的有效因子数目平均约为12个,我们认为这代表了A股投资者长期关注的风险种类的数目。从图 1中我们还可以看出,A股市场的定价因子(市场风格)时变性较强,不同时期有效定价因子的个数存在较大的差异。为了进一步说明这一点,我们将考察期内不同因子的有效次数汇总于表 3中:
由表 3可见,市场因子是考察期内有效次数最多的因子(65次),这说明市场整体表现在大部分时候是A股投资者关注的系统性风险。反映经营现金流健康水平的税收因子(50次)和盈利成长性的市盈率因子(47次)次之,说明企业的成长性和健康性也是A股市场中投资者重点关注的因素。规模因子(38次)再次之,说明A股市场中小市值效应是长期存在的。另外,反映短期和长期偿债能力的速动因子(39次)、现金因子(31次)和市场杠杆因子(31次)也在多数情况下有效。相比之下,质量因子(1次)、换手因子(4次)等的有效次数较为有限。
以上分析表明市值加权自适应LASSO模型具有较强的样本内数据拟合能力。不过众所周知的是,样本内拟合能力只是评判一个实证资产定价模型优秀与否的次要标准,更重要的是考察模型的样本外定价表现。下一小节对此进行深入考察。
-
本小节旨在对不同模型的样本外定价表现进行比较,以进一步凸显市值加权自适应LASSO模型相对于参照模型的合理性和有效性。我们在每个横截面上基于三个多因子模型(市值加权自适应LASSO模型、普通LASSO模型和WLS模型)分别预测下一期的股票收益率,据以构造样本外预测能力最优的投资组合,然后通过比较基于不同模型所构造投资组合的样本外收益率和夏普率(Sharpe Ratio)来判断模型的优劣[17, 19]。具体步骤如下:
第一步,在第t期,使用该期以前的数据估计第t期的因子收益θt。
第二步,我们使用基于t期数据估计的风险溢价参数θt预测t+1期的风险溢价,并基于第t期的因子载荷和因子收益对第t+1期的个股收益率进行预测。接着根据预期收益率的高低对股票进行排序,并通过买入高预期收益股票、卖空低预期收益股票的方式构造投资组合,记录该组合在第t+1期的实际收益率。
第三步,在每一期分别构造最优投资组合(剔除“ST”股票与次新股),从而得到最优投资组合收益率的时间序列。通过对这一序列进行业绩分析,便可对模型的样本外定价表现做出评价。
-
在后续的分析中,我们将市值加权自适应LASSO模型与四种基准模型进行了比较,分别是WLS模型、普通LASSO模型、PCA模型和ElasticNet弹性网络模型。具体来说,我们使用2013年1月-2020年11月的模型估计结果预测2013年2月-2020年12月共83个月的横截面股票收益率,并通过买入预期收益率前10%、卖空末10%的股票来构造投资组合(与已有文献中的买卖比例相同[19]),并计算不同投资组合的样本外平均收益率、波动率以及最大回撤,以此来判断不同模型的样本外定价表现是否存在差异,我们将不同多种组合的样本外表现汇报在表 4中。
从表 4可见,基于市值加权自适应LASSO模型在样本外区间的平均月频收益率为1.19%,显著高于基于WLS模型的0.47%和上证指数的同期月频超额收益率0.51%。并且,基于市值加权自适应LASSO模型在样本外区间的平均月频收益率也显著高于基于普通LASSO模型的0.91%、基于PCA模型的0.72%以及基于弹性网络模型的1.04%,表现明显优于其他三种降维模型。表现也更为稳健,市值加权自适应LASSO组合样本外收益标准差为0.045,与传统LASSO模型的0.045和弹性网络模型的0.044持平,但低于WLS的0.052、PCA的0.085以及上证指数的0.065。为了进一步验证基于市值加权自适应LASSO更精确地识别了A股市场有效定价因子,我们进一步参考已有文献,对于所构建的投资组合样本外夏普率进行比较。
-
理论上,一个因子模型越接近真实模型,其对样本外股票收益率刻画能力就越强(理论上,随机定价核的投资收益拥有最大的夏普率),根据其样本外预测构造的投资组合就应该有更好的夏普率表现。我们使用夏普率来衡量投资组合的业绩表现,其定义为:
其中SRp代表组合p的夏普率,μp和σp分别代表组合p的超额收益率的期望和标准差,通常用样本均值和样本标准差来衡量。在分别使用两种模型进行样本外预测并构造了投资组合p和q之后,便可以对这两个投资组合的夏普率进行统计检验:如果组合p的夏普率在统计意义上高于投资组合q,即可认为构造p的模型更优。
与Lewellen和Freyberger等单纯比较两个投资组合的夏普率不同[17, 19],我们使用Memmel(2003)中的统计量对两个投资组合的夏普率进行比较(Jobson-Korkie检验)[31]:
其中SRp与SRq分别代表组合p与q的夏普率的样本估计值,ρpq代表两个组合超额收益率的相关系数的样本估计值,T为时间长度。这一统计量渐进服从正态分布。
与上文类似,我们基于不同模型,通过买入预期收益率前10%、卖空末10%的股票来构造投资组合(与已有文献的买卖比例相同[19]),接着计算不同投资组合的夏普率和Jobson-Korkie统计量,以此来判断不同模型的样本外定价表现是否存在差异。此外,我们还考察了市场组合的业绩表现以确认多因子模型的整体有效性。我们发现市值加权自适应LASSO模型优于Elastic Net(弹性网络)模型,并且显著优于普通LASSO模型、PCA模型和WLS模型,基于WLS模型构建的投资组合则显著优于市场组合,详情如下。
首先是市值加权自适应LASSO模型与WLS模型的比较。相应投资组合的夏普率及Jobson-Korkie检验结果总结于表 5中。如表所示,基于市值加权自适应LASSO模型所构建组合的夏普率(SRALASSO)约为0.92,而基于WLS模型所构建组合的夏普率(SRWLS)约为0.31,前者显著高于后者,说明市值加权自适应LASSO模型的样本外定价能力远超WLS模型。
接下来是市值加权自适应LASSO模型与PCA模型的比较。相应投资组合的夏普率及Jobson-Korkie检验结果总结于表 6中。如表所示,基于市值加权自适应LASSO模型所构建组合的夏普率(SRALASSO)约为0.92,基于PCA模型所构建组合的夏普率(SRPCA)约为0.29,前者显著高于后者,说明市值加权自适应LASSO模型的样本外定价能力远远优于PCA模型。
其次是市值加权自适应LASSO模型与普通LASSO模型的比较。相应投资组合的夏普率及Jobson-Korkie检验结果总结于表 7中。如表所示,基于市值加权自适应LASSO模型所构建组合的夏普率(SRALASSO)约为0.92,基于普通LASSO模型所构建组合的夏普率(SRLASSO)约为0.70,前者显著高于后者,说明市值加权自适应LASSO模型的样本外定价能力也超过普通LASSO模型。
最后是市值加权自适应LASSO模型与弹性网络模型的比较。相应投资组合的夏普率及Jobson-Korkie检验结果总结于表 8中。如表 8所示,基于市值加权自适应LASSO模型所构建组合的夏普率(SRALASSO)约为0.92,基于普通LASSO模型所构建组合的夏普率(SRElasticNet)约为0.81,前者仍然高于后者,说明市值加权自适应LASSO模型的样本外定价能力也超过弹性网络模型。
此外我们还估算了同期上证综合指数的夏普率(SRSCI),结果仅为0.27左右,远低于上述任一多因子模型的相应结果,这一发现确认了多因子模型的整体有效性。在表 9中,我们汇报了基于WLS模型构造的组合与上证指数的夏普率及Jobson-Korkie检验结果。
为了验证结论的稳健性,下一小节重点考察了结果是否对构建投资组合时使用的多空比例敏感。我们发现在不同的多空比例下,市值加权自适应LASSO模型始终优于弹性网络模型和普通LASSO模型,而后两者则始终优于PCA模型和WLS模型,这一核心结论十分稳健。
-
作为稳健性分析的一部分,我们在不同的多空比例下重复上一小节的工作,以确认结论不受多空比例的影响。我们将市值加权自适应LASSO模型与WLS模型比较的结果汇总于表 10中。以第三行为例,这一行代表的多空比例为20%,即买入预期收益率前20%、卖空末20%的股票。可以发现,无论多空比例有多高,市值加权自适应LASSO模型的样本外预测能力始终强于WLS模型,表现为投资组合显著更高的夏普率。
类似地,我们将市值加权自适应LASSO模型与PCA模型比较的结果汇总于表 11中。可以发现,无论多空比例有多高,市值加权自适应LASSO模型的样本外预测能力始终显著强于PCA模型。
我们将市值加权自适应LASSO模型与普通LASSO模型比较的结果汇总于表 12中。可以发现,无论多空比例有多高,市值加权自适应LASSO模型的样本外预测能力始终显著强于普通LASSO模型。
我们将市值加权自适应LASSO模型与普通LASSO模型比较的结果汇总于表 13中。可以发现,无论多空比例的具体取值为多少,市值加权自适应LASSO模型的样本外预测能力始终强于弹性网络模型。
表 14显示的是基于WLS模型构造的组合与上证指数的对比,与我们的预期一致,前者的夏普率稳定地高于后者,即多因子模型的整体有效性不受多空比例的影响。
综上,市值加权自适应LASSO模型的样本外预测能力显著强于其他模型。相对于WLS模型,使用市值加权自适应LASSO方法后夏普率的提升非常明显,幅度达到200%。相对于普通LASSO模型,夏普率的提升也颇为可观,幅度达到30%。相对于基准模型中表现最好的弹性网络模型,夏普率提升幅度也达到12%。因此,至少从因子筛选的角度看,市值加权自适应LASSO方法具有明显的合理性和有效性。
此外,本文将探讨市值加权自适应LASSO模型所选出的有效定价因子在中长期的有效性。本文采用的方法是月频动态调整定价因子并估计了相应的风险溢价,并且证明了在短期的动态调整下有较强的样本外预测能力。本文接下来将测算基于不同方法的多因子模型是否在中期、长期依然有较强的预测能力。我们将中期定为12个月,在筛选出首期的有效定价因子后,未来12个月将延用已筛选因子的因子载荷和因子收益率,并在12个月后重新筛选新的有效定价因子。类似的,我们将长期定为36个月,测算投资组合在短期、中期、长期的夏普率。如表 15所示,表中第一列展示了使用实时因子筛选所得到的投资组合对应的样本外夏普率,SR代表了使用中期或者长期筛选因子对应投资组合的夏普率。我们可以发现基于本文提出的市值加权自适应LASSO模型在中期、长期的投资组合夏普率均低于短期夏普率,这也说明加权自适应LASSO模型可能存在长期预测效力下降的问题。
最后,本文为了验证在中期、长期预测的过程中市值加权自适应LASSO模型的样本外投资表现优于基于LASSO和Elastic Net构建的投资组合,我们重复了上文之中的比较并将结果汇总在表 16之中,可以发现不论是在中期还是长期筛选标准下,市值加权自适应LASSO模型的样本外投资表现依旧高于LASSO和Elastic Net模型,但是这一差异仅在中期预测上是显著的。长期投资而言,虽然加权自适应LASSO方法依旧优于WLS方法,但是与PCA、LASSO以及Elastic Net的差异并不显著,这也侧面说明在长期预测表现上不同的机器学习方法在构建样本外投资组合方面存在收敛趋势。
一. 基于市值加权自适应LASSO模型的因子收益估计:A股市场的风格变迁
二. 不同模型的样本外定价表现
1. 样本外的多空组合收益率
2. 样本外夏普率比较
三. 稳健性检验
-
期望收益率是金融市场价格发现和预测系统性风险的重要指标。为了实时甄别我国金融市场的驱动因素,本文采用了在多因子资产定价框架内,实时识别了A股市场上的有效定价因子的研究角度。为了针对对A股市场估计时变定价模型并且识别被有效定价因子的风险溢价,本文提出了一种基于市值加权的自适应LASSO算法来对多因子模型进行实时压缩,并基于我国A股市场的数据对该方法的合理性和有效性进行了探讨。结果表明,市值加权自适应LASSO算法能有效地从大量因子中筛选出关键因子,使用该方法的多因子模型的样本外定价表现显著优于作为参照模型的弹性网络(Elastic Net)模型、普通LASSO模型、PCA模型和WLS模型。本文理论上的创新之处在于将传统自适应LASSO算法和以市值为权重的最小二乘法进行结合,设计出一种既能避免模型被过度压缩、又能防止结果受到小市值股票影响的新的因子筛选方法,具有较为丰富的理论内涵和启示。此外,本文还具有较强的现实意义:对投资者而言,本文提出的预测算法能帮助投资者更精准地识别市场风格,根据该算法构造的投资组合也有着更好且更稳健的样本外表现;对监管者而言,本文提出的算法能加深监管者对股市系统性风险的认识,为监管部门有效引导市场合理投资,及时发现市场异常提供助力。
习近平总书记指出:“防范化解金融风险特别是防止发生系统性金融风险,是金融工作的根本性任务。”进入新时代,随着我国金融市场的深化发展,正确客观地认识股票市场风险的动态演化特征、市场驱动因素,理清各类宏观经济政策在影响资本市场风险周期中的作用,是防范化解系统性风险、助推经济社会高质量发展必须重视和解决的重要课题。因此,立足我国经济特点,深刻认识驱动我国资本市场因素的时序特征,探索最优资本市场治理的政策组合,对于我国有效预防、处置资本市场剧烈波动所可能带来的系统性风险具有重要意义。
本文为研究A股市场收益率的决定以及相关的系统性风险打下了基础,但未来依旧需要从经济周期理论以及我国的经济现实出发,进一步研究本文筛选出的一系列有效定价因子背后的经济学含义,更深入地探讨这些因子驱动A股市场收益率背后的经济学逻辑。


 下载:
下载: