Message Board

Dear readers, authors and reviewers,you can add a message on this page. We will reply to you as soon as possible!

2020 Volume 42 Issue 3
Article Contents

Chun-xue WANG, Shun-qian ZHANG, Bin ZHOU, et al. Characteristics of Quasi-2-Year Cycle of the Number of Spring Drought Days in Sichuan Basin and Its Response to East Asian Winter Monsoon[J]. Journal of Southwest University Natural Science Edition, 2020, 42(3): 130-138. doi: 10.13718/j.cnki.xdzk.2020.03.018
Citation: Chun-xue WANG, Shun-qian ZHANG, Bin ZHOU, et al. Characteristics of Quasi-2-Year Cycle of the Number of Spring Drought Days in Sichuan Basin and Its Response to East Asian Winter Monsoon[J]. Journal of Southwest University Natural Science Edition, 2020, 42(3): 130-138. doi: 10.13718/j.cnki.xdzk.2020.03.018

Characteristics of Quasi-2-Year Cycle of the Number of Spring Drought Days in Sichuan Basin and Its Response to East Asian Winter Monsoon

More Information
  • Corresponding author: Bin ZHOU ; 
  • Received Date: 26/11/2018
    Available Online: 20/03/2020
  • MSC: P423.3

  • Periodic characteristics of spring drought in Sichuan Basin and its response to East Asian Winter Monsoon on a quasi-2-year cycle are examined with the Multi-Taper Method-Singular Value Decomposition (MTM-SVD) method, using the MCI data in 1961-2016 from 104 meteorological stations in Sichuan Basin and the NCEP/NCAR reanalysis data in the same period The results show that the number of spring drought days in the Sichuan Basin has a quasi-2-year and a quasi-3-year cycle on the inter-annual scale, of which the quasi-2-year cycle is more significant. The typical cycle of the quasi-2-year cycle presents a pattern of alternating light and heavy spring drought, and the quasi-2-year period signal is most obvious after 1990s, 1960s takes the second place, and it almost disappeared from 1970s to the middle of 1990s. Through the analysis of coordinate change of the number of spring drought days and atmospheric pressure at sea level with the method of MTM-SVD, it is found that the East Asian Winter Monsoon has response to the number of spring drought days in a quasi-2-year cycle. In years of light spring drought, the East Asian Winter Monsoon is strong in January and February, but weakens abruptly in March and remains weak in April. In years of heavy spring drought, the East Asian Winter Monsoon is weak in January and February, and it slightly weakens in March, yet being still stronger than usual and continuing to be strong in April. Circulation analysis shows that in the seasonal transition process when the East Asian Winter Monsoon presents an abrupt (slow) change from strong (weak) to weak (strong), the spring 500 hPa height field excites a Eurasian teleconnection negative (positive) phase, leading to the weak (strong) East Asian Trough, appearing anomalous south (north) wind component in East Asia, resulting in a light (heavy) spring drought.
  • 加载中
  • [1] 康蕾, 张红旗.我国五大粮食主产区农业干旱态势综合研究[J].中国生态农业学报, 2014, 22(8):928-937.

    Google Scholar

    [2] 詹兆渝, 余勇, 胡雪.四川旱涝——国际标准三十年简述[J].四川气象, 1992, 12(3):40-44.

    Google Scholar

    [3] 李金建, 张菡, 王锐婷, 等.基于湿润指数的四川盆地农业干旱时空变化特征[J].西南大学学报(自然科学版), 2014, 36(1):129-136.

    Google Scholar

    [4] 庞艳梅, 陈超, 潘学标. 1961-2010年四川盆地冬小麦需水量时空变化[J].西南大学学报(自然科学版), 2017, 39(12):1-11.

    Google Scholar

    [5] 彭国照, 费永成, 陈林, 等. ORYZA2000水稻模型在四川盆地参数本地化及验证应用[J].西南师范大学学报(自然科学版), 2018, 43(3):125-132.

    Google Scholar

    [6] 程绍敏.四川盆地主要气象灾害对农业的影响及减灾对策[J].四川气象, 2000, 20(1):31-34.

    Google Scholar

    [7] 田宏, 徐崇浩, 彭骏, 等.四川盆地区干旱强度时空分布特征[J].四川气象, 1998, 18(2):40-44.

    Google Scholar

    [8] 张顺谦, 侯美亭, 王素艳.基于信息扩散和模糊评价方法的四川盆地气候干旱综合评价[J].自然资源学报, 2008, 23(4):713-723.

    Google Scholar

    [9] 陈少勇, 贺红梅, 吴芳蓉, 等.中国西南和华南地区春旱的气候变化特征[J].干旱区资源与环境, 2015, 29(9):138-143.

    Google Scholar

    [10] 王素艳, 游超, 何潇. 2006年四川盆地旱情及其对农业的影响评估[J].中国农业气象, 2008, 29(1):115-118, 70.

    Google Scholar

    [11] 钱维宏, 张宗婕.西南区域持续性干旱事件的行星尺度和天气尺度扰动信号[J].地球物理学报, 2012, 55(5):1462-1471.

    Google Scholar

    [12] 胡学平, 王式功, 许平平, 等. 2009-2013年中国西南地区连续干旱的成因分析[J].气象, 2014, 40(10):1216-1229.

    Google Scholar

    [13] 陈淑全.四川气候[M].成都: 四川科学技术出版社, 1997: 5-9.

    Google Scholar

    [14] CURRY J. The Contribution of Radiative Cooling to the Formation of Cold-Core Anticyclones[J]. Journal of the Atmospheric Sciences, 1987, 44(18):2575-2592.

    Google Scholar

    [15] 曾剑, 张强, 王同美.东亚冬季风与中国南方冬季降水的关系分析[J].高原气象, 2010, 29(4):975-981.

    Google Scholar

    [16] 徐建军, 朱乾根, 周铁汉.近百年东亚冬季风的突变性和周期性[J].应用气象学报, 1999, 10(1):1-8.

    Google Scholar

    [17] 潘建华, 钟晓平.四川盆地春、夏、伏旱的总体特征及旱期降水和温度之特点[J].四川气象, 1998, 18(2):32-39.

    Google Scholar

    [18] 巫娜, 罗凝谊, 许勇.四川盆地干旱灾害统计特征[J].气象科技, 2014, 42(2):309-313.

    Google Scholar

    [19] 王晓敏, 周顺武, 周兵. 2009/2010年西南地区秋冬春持续干旱的成因分析[J].气象, 2012, 38(11):1399-1407.

    Google Scholar

    [20] 黄荣辉, 刘永, 王林, 等. 2009年秋至2010年春我国西南地区严重干旱的成因分析[J].大气科学, 2012, 36(3):443-457.

    Google Scholar

    [21] 韩兰英, 张强, 姚玉璧, 等.近60年中国西南地区干旱灾害规律与成因[J].地理学报, 2014, 69(5):632-639.

    Google Scholar

    [22] 中华人民共和国国家质量监督检查检疫总局, 中国国家标准化管理委员会.气象干旱等级: GB/T 20481-2017[S].北京: 中国标准出版社, 2017.

    Google Scholar

    [23] 郭其蕴.东亚冬季风的变化与中国气温异常的关系[J].应用气象学报, 1994, 5(2):218-225.

    Google Scholar

    [24] MANN M E, PARK J. Global-scale Modes of Surface Temperature Variability on Interannual to Century Timescales[J]. Journal of Geophysical Research Atmospheres, 1994, 99(D12):25819.

    Google Scholar

    [25] Small D, Islam S. Low frequency variability in fall precipitation across the United States[J]. Water Resources Research, 2008, 44(4):W4426.

    Google Scholar

    [26] 王春学, 马振峰, 王佳津, 等.四川盆地区域性暴雨时空变化特征及其前兆信号研究[J].气象, 2017, 43(12):1517-1526.

    Google Scholar

    [27] WANG C X, MA Z F. Quasi-3-yr Cycle of Rainy Season Precipitation in Tibet Related to Different Types of ENSO during 1981-2015[J]. Journal of Meteorological Research, 2018, 32(2):181-190.

    Google Scholar

    [28] WALLACE J M, GUTZLER D S. Teleconnections in the Geopotential Height Field during the Northern Hemisphere Winter[J]. Monthly Weather Review, 1981, 109(4):784-812.

    Google Scholar

    [29] 刘毓赟, 陈文.北半球冬季欧亚遥相关型的变化特征及其对我国气候的影响[J].大气科学, 2012, 36(2):423-432.

    Google Scholar

    [30] 左璇.北半球中高纬度遥相关型持续异常及其对中国冬季气候的影响[D].南京: 南京信息工程大学, 2013.

    Google Scholar

  • 加载中
通讯作者: 陈斌, bchen63@163.com
  • 1. 

    沈阳化工大学材料科学与工程学院 沈阳 110142

  1. 本站搜索
  2. 百度学术搜索
  3. 万方数据库搜索
  4. CNKI搜索

Figures(8)

Article Metrics

Article views(3787) PDF downloads(220) Cited by(0)

Access History

Characteristics of Quasi-2-Year Cycle of the Number of Spring Drought Days in Sichuan Basin and Its Response to East Asian Winter Monsoon

    Corresponding author: Bin ZHOU ; 

Abstract: Periodic characteristics of spring drought in Sichuan Basin and its response to East Asian Winter Monsoon on a quasi-2-year cycle are examined with the Multi-Taper Method-Singular Value Decomposition (MTM-SVD) method, using the MCI data in 1961-2016 from 104 meteorological stations in Sichuan Basin and the NCEP/NCAR reanalysis data in the same period The results show that the number of spring drought days in the Sichuan Basin has a quasi-2-year and a quasi-3-year cycle on the inter-annual scale, of which the quasi-2-year cycle is more significant. The typical cycle of the quasi-2-year cycle presents a pattern of alternating light and heavy spring drought, and the quasi-2-year period signal is most obvious after 1990s, 1960s takes the second place, and it almost disappeared from 1970s to the middle of 1990s. Through the analysis of coordinate change of the number of spring drought days and atmospheric pressure at sea level with the method of MTM-SVD, it is found that the East Asian Winter Monsoon has response to the number of spring drought days in a quasi-2-year cycle. In years of light spring drought, the East Asian Winter Monsoon is strong in January and February, but weakens abruptly in March and remains weak in April. In years of heavy spring drought, the East Asian Winter Monsoon is weak in January and February, and it slightly weakens in March, yet being still stronger than usual and continuing to be strong in April. Circulation analysis shows that in the seasonal transition process when the East Asian Winter Monsoon presents an abrupt (slow) change from strong (weak) to weak (strong), the spring 500 hPa height field excites a Eurasian teleconnection negative (positive) phase, leading to the weak (strong) East Asian Trough, appearing anomalous south (north) wind component in East Asia, resulting in a light (heavy) spring drought.

  • 四川盆地是我国五大粮食生产区之一,几乎每年遭受的各种自然灾害中超过50%是旱灾[1],习惯上把四川盆地干旱分为春旱(3-4月)、夏旱(5-6月)和伏旱(7-8月),其中春旱发生最频繁,范围最广泛[2-5].春季是四川盆地农业生产的关键季节,春旱不利于小春作物的生长和大春作物的播栽;在季节性连旱事件中,春旱也往往处在事件开端或结束的重要阶段[6],所以对四川盆地春旱变化规律和形成机理的研究至关重要.田宏等[7]发现,1960-1970年四川盆地春旱的轻、重旱年转换频繁,年际波动大;1980-1990年轻、重旱年转换明显变慢,年际波动变小.张顺谦等[8]的研究指出,四川盆地春旱大约每2.5年出现一次.陈少勇等[9]的研究也表明,1961-2010年我国西南地区春旱强度有减轻趋势,并且轻旱有显著的2.2年周期.进入21世纪以来,四川多次出现季节性连旱,如2006年的春—夏—伏连旱[10],2009至2010年的秋—冬—春连旱[11],以及2012至2013年的秋—冬—春连旱[12],给社会生产和人民生活带来了严重威胁.

    春季是过渡季节,四川盆地与长江中下游同纬度地区相比春雨少于秋雨,这是四川盆地春季的气候特点,也是四川盆地春旱发生的直接原因,而春季四川盆地冬季风活跃,尤其在初春冬季环流特征仍然非常明显[13],所以东亚冬季风异常很可能是四川盆地春旱的重要影响因子. Curry[14]认为西伯利亚高压的发展直接影响北方冷空气的爆发,所以用高压强度可以表征东亚冬季风的强弱.曾剑等[15]的研究表明,四川东北部对东亚冬季风有明显的响应,强冬季风对应降水偏少,而弱冬季风对应降水偏多.徐建军等[16]发现东亚冬季风也存在准2年周期振荡.

    以往四川盆地春旱的研究更多关注的是监测评估方法和时空变化规律[17-18],有关四川盆地春旱成因的研究相对较少,并且集中在西南区域或季节连旱事件[19-21].本研究利用MTM-SVD方法,在分析四川盆地春旱准2年周期特征的基础上,探讨其对东亚冬季风的响应情况,以期为春旱的气候预测提供技术支撑,为抗旱减灾的决策服务提供科学参考.

1.   资料和方法
  • 1) 四川盆地104个气象台站1961-2016年3-4月逐日的气象干旱综合监测指数(MCI),当MCI≤-0.5时,记为一个干旱日,统计3-4月累计干旱日数为当年春旱日数.

    2) NCEP/NCAR月平均海平面气压场、500 hPa高度场和经向风场等再分析资料,分辨率为2.5°×2.5°.

  • 1) 2017年国家气候中心在CI指标基础上修订了《气象干旱等级》国家标准[22],建立了MCI干旱指数,计算公式如下:

    式中:SPIW60为近60天标准化权重降水指数;Pn为距离当天前第n天降水量;MI30为近30天湿润度指数;SPI90SPI150分别为90天和150天标准化降水指数. abcd为经验权重系数,四川盆地属于西部地区,分别取0.3,0.5,0.3,0.2.

    2) 东亚冬季风的强度主要取决于西伯利亚高压发展的程度,用西伯利亚高压中心3个点(60°N,100°E;60°N,90°E;50°N,100°E)的海平面气压平均值代表东亚冬季风的强度[23].

    3) MTM-SVD方法是由Mann等[24]提出的一种多变量频域分解技术.这是一种将谱分析的多锥度方法(Multi-Taper Method,MTM)和变量场的奇异值分解(Singular Value Decomposition,SVD)方法结合在一起的气候信号检测技术.近年来MTM-SVD被广泛应用在气象科研领域[25-27].

    MTM-SVD方法的主要特点是:①分析对象不仅可以是一维时间序列,也可以是多维或多站点的气候变量场,它可以非常便利地分析气候变量场整体所具有的谱特征. ②包含了MTM方法,通过变量场时间序列与多个锥度相乘,使得在谱解析度和谱的变异之间达到了一个最佳的平衡,有效防止谱泄漏现象. ③通过MTM-SVD方法得到的LFV(Local Fractional Variance)谱在频域中为信号检测提供了一个有效的参数,它以频率函数的形式表明了由“每个频率波段”中的主要振动解释的方差百分比. LFV谱中,在一个给定频率处的波峰预示着数据在此频率处振荡的一个潜在重要的时空信号.这样更加直观、简便地显示出变量场不同时间尺度的变化特征. ④可以为所有时间和区域重建时空信号.这种信号的重建可以更直观地分析和描述不同时间尺度振动的时间—空间演变特征和过程. ⑤ MTM-SVD技术在其应用上可扩展到耦合的区域,即在同一时刻多于一个的区域的耦合.

2.   四川盆地春旱周期特征
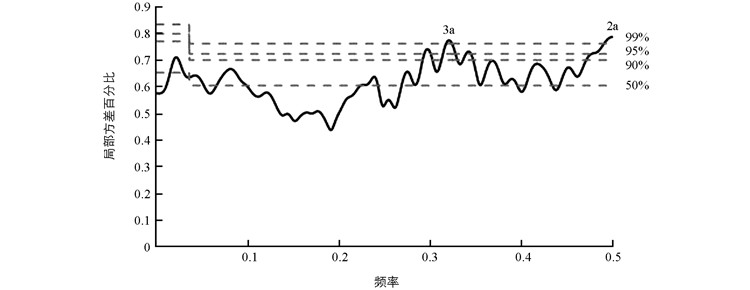
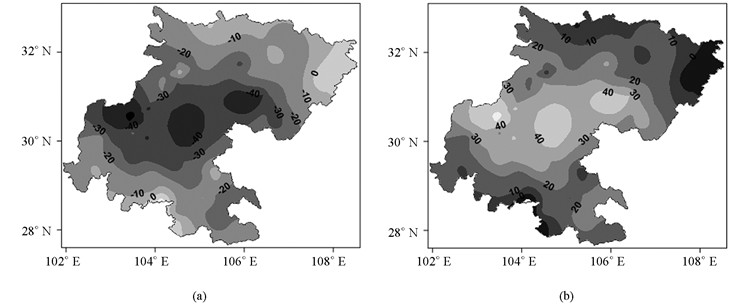
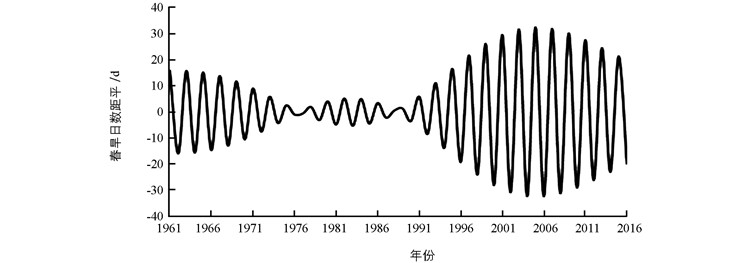
  • 利用MTM-SVD方法分析1961-2016年四川盆地春旱日数的周期特征,图 1为春旱日数的LFV谱,可以看到年代际尺度上的峰值都没有通过90%的置信度,而年际尺度上的准2年周期和准3年周期都达到了99%的置信度水平,其中准2年周期峰值对应的LFV谱值更大.用MTM-SVD方法对四川盆地春旱日数的准2年周期进行典型循环重建,从图 2中可以看到,第1年(0°位相)整体表现为春旱异常偏轻,负异常大值中心出现在盆地中部地区;第2年(180°位相)整体表现为春旱异常偏重,正异常大值中心也在盆地中部;第3年(360°位相)异常分布与第1年一致(图略),开始下一个周期循环.为了研究这种准2年周期是否一直稳定存在,选择异常大值中心站点(大邑站),重建其准2年周期(图 3),可以看到准2年周期存在年代际差异,其中1990年代后期以来最显著,1960年代次之,1970-1990年代中期准2年周期信号非常弱.进一步分析可知,四川盆地春旱准2年周期典型循环的异常分布与其EOF展开主模态基本一致,并且准2年周期信号的时间变化与主模态时间系数也有很好的对应关系,即准2年周期是四川盆地春旱的一个主要年际变化信号.

3.   对东亚冬季风的响应
  • 气候平均情况下(图 4a3-d3),1-4月西伯利亚高压强度逐渐减弱,范围逐渐向西北退缩,即一般情况冬、春季节的转换是在东亚冬季风逐渐减弱消退的平稳过程中完成的,初春仍然受冬季环流系统控制,只是强度有所减弱.

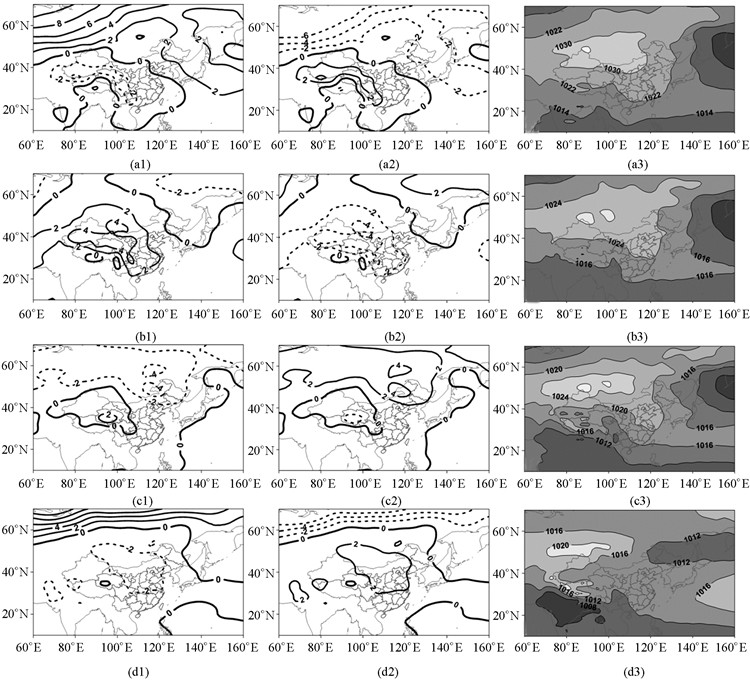
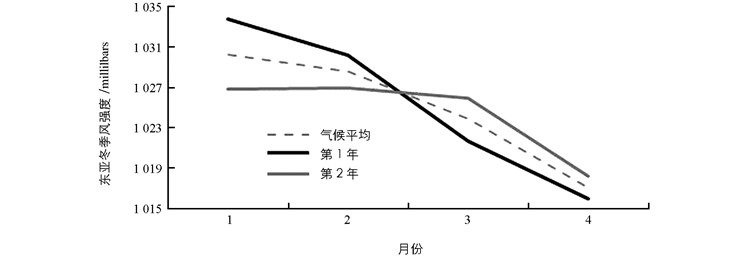
    从四川盆地春旱日数与海平面气压耦合场在准2年周期的典型循环重建可以发现,第1年1月份(图 4a1)40°N以北的大部地区海平面气压偏高,南部海平面气压偏低,即西伯利亚高压偏强偏北;2月份(图 4b1)西伯利亚高压偏强偏南;3月份(图 4c1)西伯利亚高压以偏弱为主;4月份(图 4d1)西伯利亚高压偏弱更加明显.第2年1-4月份海平面气压异常状况与第1年相反. 图 5给出了东亚冬季风强度指数的变化,从中更容易发现其变化规律,即气候平均情况1-4月东亚冬季风强度缓慢减弱,而在准2年周期典型循环的第1年冬季(1-2月)东亚冬季风显著偏强,3月突然减弱,4月仍然维持在偏弱状态,对应四川盆地春旱日数偏少(图 2a);第2年冬季(1-2月)东亚冬季风显著偏弱,而3月减弱不明显,但较常年偏强,4月份仍然偏强,对应四川盆地春旱日数偏多(图 2b).

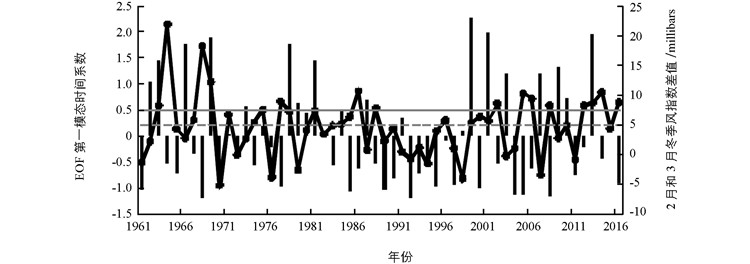
    以上四川盆地春旱强弱与东亚冬季风转变的对应关系仅仅是从准2年周期振荡过程中发现的,在实际情况中是否存在还需验证.本研究将2月与3月冬季风指数差值作为衡量季风转换情形的一个指标,差值为正,且大于1.5倍标准差时,认为冬季风转换属于突然减弱型;差值为正,且小于1倍标准差,认为冬季风转换属于缓慢减弱型.对四川盆地春旱日数进行EOF展开,第一模态为主模态,方差贡献率达42.2%. 图 6给出了第一模态时间系数与冬季风转换指标的对应关系,可发现冬季风突然减弱型共有16年,其中有12年四川盆地春旱偏轻,实际对应率达75%;冬季风缓慢减弱型共18年,其中10年四川盆地春旱偏重,实际对应率为56%,即东亚冬季风的这两种转换类型与四川盆地春旱有较好的对应关系,这也从侧面说明了准2年周期振荡在四川盆地春旱年际波动中的重要性.

4.   环流背景分析
  • 欧亚遥相关是冬季北半球500 hPa高度上的5种大气遥相关型之一[28],刘毓赟等[29]发现冬季欧亚遥相关有显著的2-4年周期,当欧亚遥相关处于正(负)位相时,我国东部降水偏少(多).研究表明欧亚遥相关型与西伯利亚高压关系密切[30].

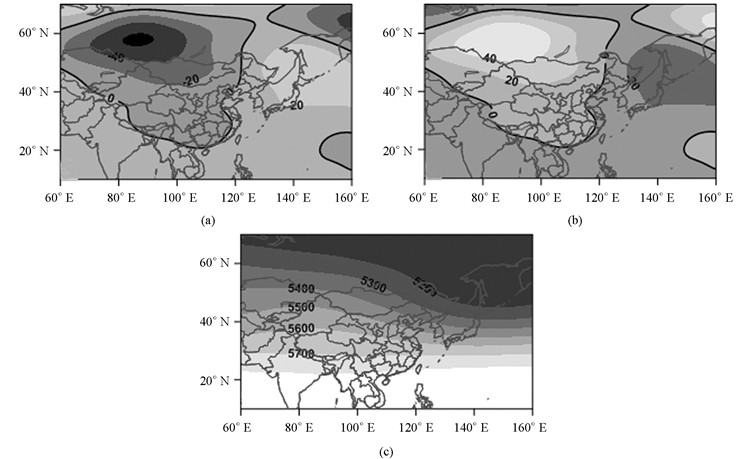
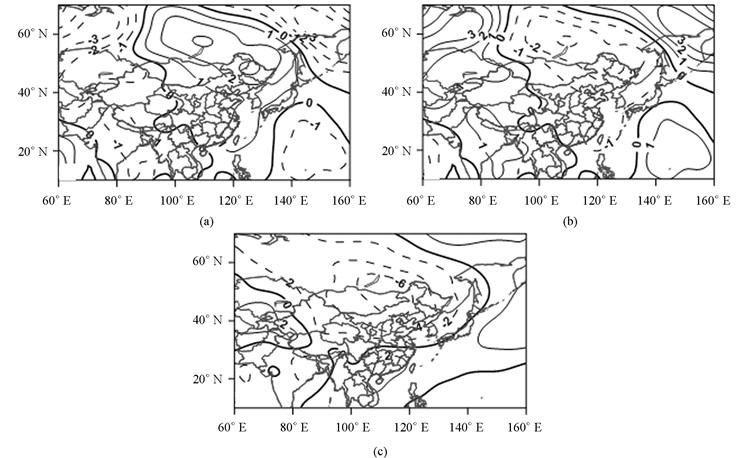
    春季500 hPa主要环流系统仍为东亚大槽,大槽的平均位置较冬季变化不大,但强度有所减弱(图 7c).用相同的方法对四川盆地春旱日数与春季500 hPa高度耦合场在准2年周期上进行典型循环重建,发现第1年(图 7a),500 hPa高度场上乌拉尔山地区为负异常,东亚沿海为正异常,即出现欧亚遥相关负位相,导致东亚大槽偏弱;第2年相反(图 7b),出现欧亚遥相关正位相,导致东亚大槽偏强.

  • 从气候平均场来看(图 8c),春季我国长江以北地区,包括四川盆地都主要受干冷的北风控制,而华南地区则以南风为主.同样的方法重建500 hPa经向风的准2年周期,发现第1年(图 8a)东亚中东部,包括四川盆地,都出现异常南风分量,对应四川盆地春旱偏弱(图 2a);第2年(图 8b)四川盆地出现异常北风分量,对应四川盆地春旱偏强(图 2b).

5.   结论
  • 1) 1961-2016年四川盆地春旱日数在年代际尺度上没有显著的周期信号,在年际尺度上的准2年周期最明显.准2年周期的典型循环重建表明,第1年四川盆地整体春旱异常偏轻,第2年盆地春旱异常偏重.四川盆地春旱准2年周期信号在1990年代后期至今最显著,1960年代次之,1970-1990年代中期几乎消失.

    2) 在准2年周期典型循环中,第1年冬季(1-2月)东亚冬季风显著偏强,3月突然减弱,4月仍然维持在偏弱状态;第2年冬季(1-2月)东亚冬季风显著偏弱,而3月减弱不明显,但较常年偏强,4月份仍然偏强.即在准2年典型循环下,当冬季风出现先强后弱的突然转换时,四川盆地春旱日数偏少,相反当冬季风出现先弱后强的缓慢转换时,四川盆地春旱日数偏多.

    3) 环流分析表明,在准2年周期典型循环中,第1年500 hPa高度场上乌拉尔山地区为负异常,东亚沿海为正异常,呈欧亚遥相关负位相,东亚大槽偏弱,东亚中东部出现异常南风分量,导致四川盆地春旱偏弱;第2年出现欧亚遥相关正位相,东亚大槽偏强,东亚中东部出现异常北风分量,造成四川盆地春旱偏强.

Figure (8)  Reference (30)

Catalog

    /

    DownLoad:  Full-Size Img  PowerPoint
    Return
    Return