Message Board

Dear readers, authors and reviewers,you can add a message on this page. We will reply to you as soon as possible!

2021 Volume 43 Issue 7
Article Contents

ZHOU Li, ZHANG Bin, WU Bin. Spatio-Temporal Variation and Mutation Analysis of Extreme Precipitation in the Sichuan-Yunnan Agro-pastoral Ecotone[J]. Journal of Southwest University Natural Science Edition, 2021, 43(7): 157-164. doi: 10.13718/j.cnki.xdzk.2021.07.020
Citation: ZHOU Li, ZHANG Bin, WU Bin. Spatio-Temporal Variation and Mutation Analysis of Extreme Precipitation in the Sichuan-Yunnan Agro-pastoral Ecotone[J]. Journal of Southwest University Natural Science Edition, 2021, 43(7): 157-164. doi: 10.13718/j.cnki.xdzk.2021.07.020

Spatio-Temporal Variation and Mutation Analysis of Extreme Precipitation in the Sichuan-Yunnan Agro-pastoral Ecotone

More Information
  • Received Date: 30/03/2020
    Available Online: 20/07/2021
  • MSC: P426.61+4

  • In this paper, no-missing daily precipitation data during 1971-2015 fromuniformly distributed stations in the Sichuan-Yunnan agro-pastoral ecotone were used to investigate the spatial and temporal evolution and mutation characteristics of extreme precipitationin this region with the Thiessen polygons method, trend analysis, Mann-Kendall test, running t test and inverse distance weight spatial interpolation method. The main results were as follows. In the period from 1971to 2015, the regional average of R95pTOT, R95pD, RX1day, and RX5day were allon the rise. R95pD in the Songpan Plateau was higher than that in any other regions. In the Hengduanmountains, except for R95pD, all the other extreme precipitation indexes were larger than those of the Songpan Plateau and the Western Sichuan Plateau. The changes of these indices in the Western Sichuan Plateau were greater than those of the Songpan Plateau and the Hengduanmountains. The large value areas of rising R95pTOT and R95pD were concentrated in the eastern part of the Western Sichuan Plateau and the eastern part of the Hengduanmountains, and the large value areas of decline were distributed in the southwest of the Hengduanmountains. With the increase of duration from RX1day to RX5day, the areas where extreme precipitation decreased expandedsignificantly while the area where extreme precipitation increased narrowedsignificantly. The mutation events of extreme precipitation indexes in Litang station and Muli station occurred around the same timeframe, i.e. in the 1970s and the 1980s.
  • 加载中
  • [1] SCHERRER S C, BEGERT M, CROCI-MASPOLI M, et al. Long Series of Swiss Seasonal Precipitation: Regionalization, Trends and Influence of Large-Scale Flow[J]. International Journal of Climatology, 2016, 36(11): 3673-3689. doi: 10.1002/joc.4584

    CrossRef Google Scholar

    [2] IPCC. Climate Change 2007: The Physical Science Basis[M]. Cambridge: Cambridge University Press, 2007.

    Google Scholar

    [3] FIELD C B, BARROS V, STOCKER T F, et al. Managing the Risks of Extreme Events and Disasters to Advance Climate Change Adaptation[M]. Cambridge: Cambridge University Press, 2009.

    Google Scholar

    [4] MIN S K, ZHANG X B, ZWIERS F W, et al. Human Contribution to More-Intense Precipitation Extremes[J]. Nature, 2011, 470(7334): 378-381. doi: 10.1038/nature09763

    CrossRef Google Scholar

    [5] FRICH P, ALEXANDER L V, DELLA-MARTA P, et al. Observed Coherent Changes in Climatic Extremes during the Second Half of the Twentieth Century[J]. Climate Research, 2002, 19: 193-212. doi: 10.3354/cr019193

    CrossRef Google Scholar

    [6] DIAZ H F, GROSJEAN M, GRAUMLICH L. Climate Variability and Change in High Elevation Regions: Past, Present and Future[J]. Climatic Change, 2003, 59(1-2): 1-4.

    Google Scholar

    [7] ZHAO P, YANG S, YU R C. Long-Term Changes in Rainfall over Eastern China and Large-Scale Atmospheric Circulation Associated with Recent Global Warming[J]. Journal of Climate, 2010, 23(6): 1544-1562. doi: 10.1175/2009JCLI2660.1

    CrossRef Google Scholar

    [8] 陈全功, 张剑, 杨丽娜. 基于GIS的中国农牧交错带的计算和模拟[J]. 兰州大学学报(自然科学版), 2007, 43(5): 24-28.

    Google Scholar

    [9] LI Z X, HE Y Q, WANG C F, et al. Spatial and Temporal Trends of Temperature and Precipitation during 1960-2008 at the Hengduan Mountains, China[J]. Quaternary International, 2011, 236(1-2): 127-142. doi: 10.1016/j.quaint.2010.05.017

    CrossRef Google Scholar

    [10] WU F F, WANG X, CAI Y P, et al. Spatiotemporal Analysis of Precipitation Trends under Climate Change in the Upper Reach of Mekong River Basin[J]. Quaternary International, 2016, 392: 137-146. doi: 10.1016/j.quaint.2013.05.049

    CrossRef Google Scholar

    [11] 中国科学院成都地理研究所泥石流研究室. 川西滇北山区泥石流灾害防治试点研究[J]. 山地研究, 1986, 4(1): 21-32.

    Google Scholar

    [12] 胡娟, 闵颖, 李华宏, 等. 云南省山洪地质灾害气象预报预警方法研究[J]. 灾害学, 2014, 29(1): 62-66.

    Google Scholar

    [13] LI Z X, HE Y Q, WANG P Y, et al. Changes of Daily Climate Extremes in Southwestern China during 1961-2008[J]. Global and Planetary Change, 2012, 80-81: 255-272. doi: 10.1016/j.gloplacha.2011.06.008

    CrossRef Google Scholar

    [14] 袁文德, 郑江坤, 董奎. 1962-2012年西南地区极端降水事件的时空变化特征[J]. 资源科学, 2014, 36(4): 766-772.

    Google Scholar

    [15] 罗玉, 范广洲, 周定文, 等. 近41年西南地区极端温度变化趋势[J]. 西南大学学报(自然科学版), 2016, 38(5): 161-167.

    Google Scholar

    [16] 胡豪然, 毛晓亮, 梁玲. 近50年四川盆地汛期极端降水事件的时空演变[J]. 地理学报, 2009, 64(3): 278-288.

    Google Scholar

    [17] 张顺谦, 马振峰. 1961-2009年四川极端强降水变化趋势与周期性分析[J]. 自然资源学报, 2011, 26(11): 1918-1929.

    Google Scholar

    [18] 孙晨, 程志刚, 毛晓亮, 等. 近44a四川地区极端气候变化趋势及特征分析[J]. 兰州大学学报(自然科学版), 2017, 53(1): 119-126.

    Google Scholar

    [19] CHEN F L, CHEN H M, YANG Y Y. Annual and Seasonal Changes in Means and Extreme Events of Precipitation and Their Connection to Elevation over Yunnan Province, China[J]. Quaternary International, 2015, 374: 46-61.

    Google Scholar

    [20] 杜华明, 延军平, 王鹏涛. 北方农牧交错带干旱灾害及其对暖干气候的响应[J]. 干旱区资源与环境, 2015, 29(1): 124-128.

    Google Scholar

    [21] 赵威, 韦志刚, 郑志远, 等. 1964-2013年中国北方农牧交错带温度和降水时空演变特征[J]. 高原气象, 2016, 35(4): 979-988.

    Google Scholar

    [22] 龙胤慧, 廖梓龙. 基于泰森多边形法的庆阳市面雨量计算[J]. 河北工程大学学报(自然科学版), 2012, 29(3): 64-67.

    Google Scholar

    [23] HU Q, PAN F F, PAN X B, et al. Trends in Agricultural Heat and Solar Radiation Resources in Northeast China: a Multistage Spatio-Temporal Analysis[J]. International Journal of Climatology, 2016, 36(6): 2461-2468.

    Google Scholar

    [24] 曾波, 闫彩霞, 余莲. 我国南方地区1960-2009年冬季气温分析[J]. 高原山地气象研究, 2016, 36(2): 46-52.

    Google Scholar

    [25] 向辽元, 陈星. 近55年中国大陆气温突变的区域特征和季节特征[J]. 气象, 2006, 32(6): 44-47.

    Google Scholar

    [26] 沈姣姣, 徐虹, 李建科, 等. 近60年西安市24节气气温变化特征及突变分析[J]. 资源科学, 2013, 35(3): 646-654.

    Google Scholar

  • 加载中
通讯作者: 陈斌, bchen63@163.com
  • 1. 

    沈阳化工大学材料科学与工程学院 沈阳 110142

  1. 本站搜索
  2. 百度学术搜索
  3. 万方数据库搜索
  4. CNKI搜索

Figures(7)  /  Tables(1)

Article Metrics

Article views(3895) PDF downloads(532) Cited by(0)

Access History

Other Articles By Authors

Spatio-Temporal Variation and Mutation Analysis of Extreme Precipitation in the Sichuan-Yunnan Agro-pastoral Ecotone

Abstract: In this paper, no-missing daily precipitation data during 1971-2015 fromuniformly distributed stations in the Sichuan-Yunnan agro-pastoral ecotone were used to investigate the spatial and temporal evolution and mutation characteristics of extreme precipitationin this region with the Thiessen polygons method, trend analysis, Mann-Kendall test, running t test and inverse distance weight spatial interpolation method. The main results were as follows. In the period from 1971to 2015, the regional average of R95pTOT, R95pD, RX1day, and RX5day were allon the rise. R95pD in the Songpan Plateau was higher than that in any other regions. In the Hengduanmountains, except for R95pD, all the other extreme precipitation indexes were larger than those of the Songpan Plateau and the Western Sichuan Plateau. The changes of these indices in the Western Sichuan Plateau were greater than those of the Songpan Plateau and the Hengduanmountains. The large value areas of rising R95pTOT and R95pD were concentrated in the eastern part of the Western Sichuan Plateau and the eastern part of the Hengduanmountains, and the large value areas of decline were distributed in the southwest of the Hengduanmountains. With the increase of duration from RX1day to RX5day, the areas where extreme precipitation decreased expandedsignificantly while the area where extreme precipitation increased narrowedsignificantly. The mutation events of extreme precipitation indexes in Litang station and Muli station occurred around the same timeframe, i.e. in the 1970s and the 1980s.

  • 在世界许多地区,极端降水是最重要的气候变量之一[1],降水对自然和社会环境有着实质性的影响. 政府间气候变化专门委员会(IPCC)认为,由于气候变化和人类活动,极端降水事件的数量和强度将继续增加[2-3]. 例如,2000-2019年,国际灾害数据库(EM-DAT:The Emergency Events Database)报告全球共发生3 174起洪水灾害,远远超过1960-1999年报告的1 807起洪水灾害. 显然,在地形复杂的地区,极端降水强度的增加会导致更多的地貌灾害,如山洪、水土流失、山体滑坡、泥石流等. 因此,对极端降水事件的空间分布和趋势进行评价是十分重要和迫切的. 极端降水事件引起了科学界越来越多的关注. 在过去几十年中,极端降水事件的增加趋势已在气候较温暖的大多数地区得到了检测[4]. 然而,全球各地极端降水的空间格局有很大的差异[5]. 以往研究表明,极端降水对气候变暖具有高敏感性,尤其是在山地和高原地区[6],这种趋势在极端降水事件较为常见的中国西南地区最为明显[7].

    川滇农牧交错带位于中国西南部,东经98°08′-104°58′,北纬26°28′-34°19′,包括川西36个县和滇西北7个县[8],除少数县的部分地区外,43个县大部分属于青藏高原. 川滇农牧交错带地形复杂,以高原和高山峡谷为主要地貌类型,包括3个地貌单元:松潘高原、四川西部高原和横断山脉(图 1). 南部的横断山脉表现为南北向高山与纵谷交错分布[9],大多数河流由北向南流动. 横断山脉阻挡了东西向的东亚季风,为南北向的南亚季风提供了通道[10]. 川西高原和松潘高原分别位于中部和北部地区. 川滇农牧交错带是青藏高原到云贵高原和四川盆地的主要过渡地带,是中国滑坡、山洪、泥石流的主要发生地区,极端降水在这些地貌灾害中起着重要作用[11-12].

    目前针对西南地区极端降水的时空变化特点,国内外学者做了许多工作[13-15],研究区包括四川省[16-18]、云南省[19]. 但以上研究区域范围较大,对极端强降水反应敏感的川滇农牧交错带研究甚少,而对中国北方农牧交错带的研究较多[20-21]. 因此,本文拟研究近45年来川滇农牧交错带极端降水的时空演变及趋势,对理解研究区与极端降水相关的灾害和制定适当的适应和缓解战略至关重要.

1.   数据来源与方法
  • 川滇农牧交错带DEM数据来源于地理空间数据云(http://www.gscloud.cn/),气候数据是由中国气象科学数据共享服务网(http://cdc.cma.gov.cn)提供的逐日降水数据序列. 选取1971-2015年川滇农牧交错带20个分布均匀、无缺测情况的站点(图 1). 采用气候变化检测和指数专家小组定义的极端降水指数中的4个指标(表 1),对川滇农牧交错带极端降水事件近45年来的时空变化特征进行分析.

  • 采用泰森多边形法[22]和一元线性回归方程计算各极端降水系列的气候倾向率[23],并利用Mann-Kendall[24]和滑动T检验[25]对极端降水指数时间序列的突变特性进行分析;运用反距离权重空间插值法(IDW)对川滇农牧交错带极端降水进行空间分析.

2.   结果与分析
  • 通过泰森多边形法赋予研究区各个站点不同的权重系数,分别计算川滇农牧交错带全区域以及松潘高原、川西高原和横断山区的极端降水指数. 图 2-3分别显示了4个极端降水指数的年际变化序列.

  • 图 2a可以发现,川滇农牧交错带全区域R95pTOT有微弱上升趋势,经检验达到0.1显著性水平. 松潘高原、川西高原和横断山区R95pTOT均有较弱的上升趋势,其中川西高原上升趋势相对最大,经检验达到0.1显著性水平,说明川滇农牧交错带强降水量在增加,更易发生山洪、泥石流等灾害. 全区域R95pTOT多年均值达到144.56 mm,松潘高原、川西高原和横断山区R95pTOT多年均值分别为143.69,130.27,182.45 mm,横断山区R95pTOT比松潘高原和川西高原高27.00%和40.06%. 因此,大于95%分位数的强降水占该区域降水的比例在19.23%~21.69%,其中横断山区和松潘高原在年降水总量呈下降趋势的前提下,强降水量仍表现出上升趋势. 由图 2b可见,川滇农牧交错带全区域(经检验达到0.1显著性水平)、松潘高原、川西高原以及横断山区的R95pD均表现出波动上升趋势. 其中,松潘高原R95pD多年均值和气候倾向率均为最大. 横断山区R95pD多年均值和气候倾向率均为最小,同时,横断山区R95pTOT为最大,揭示出横断山区是研究区强降水量最大且在时间上最集中的区域,是川滇农牧交错带最易发生山洪、泥石流等灾害的区域.

  • 图 3可见,川滇农牧交错带全区域、松潘高原、川西高原和横断山区RX1day均呈上升趋势,且川西高原上升幅度最大,经检验达到0.05显著性水平;同时,横断山区RX1day多年均值最大,高于川西高原43.25%,加之气候倾向率为正,导致该区域一日最大降水量仍为全区域最高. 全区域、松潘高原和川西高原RX5day均呈波动上升趋势,且川西高原上升幅度最大,而横断山区则呈波动下降趋势. 因此川滇农牧交错带短历时的极端降水呈上升趋势,且横断山区在时间上的集中性比其他区域表现得更为明显.

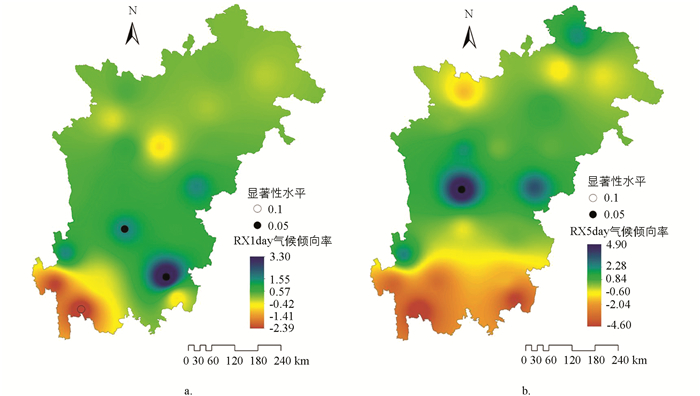
  • 运用反距离权重空间插值法将各站点极端降水指数的气候倾向率进行可视化,如图 4-5所示.

  • 总体来看R95pTOT变化的空间分布(图 4a),川滇农牧交错带中东部升高,西北、西南两侧降低;川西高原表现为以上升趋势为主,高值区位于川西高原东部的小金和康定附近;松潘高原仍以上升趋势为主,横断山区西南部和东南部主要呈下降趋势. R95pD与R95pTOT有较相似的空间分布(图 4b),上升的高值区分布在川西高原东部的小金和康定以及横断山区东部的木里,经检验均达到0.05或0.1显著性水平. 下降大值区分布在横断山区西部的贡山. 川滇农牧交错带东部地区R95pTOT与R95pD均呈现显著上升趋势,说明该地区受极端降水的影响在加大.

  • 图 5可见,RX5day较RX1day的下降区有明显扩大,上升区则有明显缩小. 全区域大部分站点的RX1day呈上升趋势,松潘高原和川西高原呈上升趋势的站点分别占各区域的66.67%和72.73%,仅横断山区以下降趋势为主,约66.67%的站点表现为下降趋势. RX5day空间变化差异明显,松潘高原和横断山区以下降趋势为主,约占各所在区域站点总数的66.67%和83.33%,而川西高原主要表现为上升趋势,约占川西高原站点总数的81.82%. 整体来说,RX1day,RX5day以上升趋势为主,表明川滇农牧交错带极端强降水的量和强度均呈上升趋势,且极端强降水事件的发生在较短历时的情况下增加更为显著.

  • 极端降水的显著变化趋势对川滇农牧交错带洪灾风险有可能造成重要影响,因此,通过Mann-Kendall检验,选取有显著变化趋势的木里、理塘两个典型站点,对其极端降水情况做突变检验. 图 6-7为近45年川滇农牧交错带4个极端降水指标典型站点的M-K检验,UF和UB分别为按顺序和逆序时间序列计算的统计量序列[13]. 若UF(UB)大于0,表示序列呈上升趋势,反之则呈下降趋势. 图中红色虚线为临界线,临界值为±1.96,即达到0.05的显著性水平,绝对值大于1.96的UF(UB)表示下降或上升趋势显著. 当UF和UB在临界线之间出现唯一交点,则交点对应的时刻为突变开始时间;当UF和UB出现多个交点,利用滑动T检验法做进一步显著性检验,能通过检验的交点对应的年份为序列发生突变的年份[26];当UF或UB超过临界线,超过临界线的范围则为出现突变的时间区域.

  • 图 6a可知,UF与UB在1984-1985年和1991年出现3次交点,均落在临界线内,且UF值大于0,说明木里站R95pTOT可能的突变发生在1984-1985和1991年左右,且R95pTOT呈上升趋势,因此有必要对突变年份进行进一步确定,对UF和UB曲线的3个交点进行滑动T检验,仅1984年的交点通过显著性检验,说明1984年木里站R95pTOT出现了突然上升的过程. 图 6b中,UF与UB在1976年存在1个交点,且交点落在临界线之间,说明木里站R95pD在1976年前后发生了1次突变,且在1976年之后UF值大于0,表明在1976-2015年有持续增加趋势,1984年开始增加趋势通过0.05的显著性水平检验,说明木里站R95pD在1976年发生了1次明显的突变后呈增长趋势,并在1984年后呈明显的持续增长. 从图 6可知,木里站R95pTOT突变比R95pD突变发生晚,且R95pD上升趋势较R95pTOT显著.

  • 图 7a可知,木里站RX1day于1971-1986年期间处于上升—下降持续波动状态,1986年开始出现稳定上升(UF>0),且在1997年先后出现显著上升. 理塘站RX5day(图 7(b))在1979年发生突变后,持续上升(UF>0),并于1989年出现显著上升.

    从川滇农牧交错带两个典型站点4个极端降水指标的M-K突变检测可知,木里站和理塘站发生突变的时间较接近,整体来看,突变的时间大致发生在20世纪70-80年代.

3.   结论与讨论
  • (1) 川滇农牧交错带全区域的平均极端降水指数中,R95pTOT,R95pD,RX1day,RX5day均呈上升趋势;松潘高原R95pD为各区域最高,而横断山区除R95pD外,其他各极端降水指数均大于松潘高原和川西高原;同时,川西高原各指数年际变化比松潘高原和横断山区更剧烈.

    (2) R95pTOT与R95pD的空间分布相似,上升的大值区均集中在川西高原东部和横断山区东部,下降大值区均分布在横断山区西南部. 同时,RX1day,RX5day以上升趋势为主,且随着持续时间的延长,极端降水量的上升区有明显的缩小,下降区有明显的扩大,说明极端强降水事件的发生在较短历时的情况下增加更为显著.

    (3) 近45年来川滇农牧交错带典型站点极端降水指数突变的时间大致发生在20世纪70-80年代. R95pD,RX5day发生突变的时间最早,分别发生在1976年和1979年左右;其次为R95pTOT,RX1day,突变依次发生1984年和1986年. 需要强调的是,以上4个指标均发生突变上升趋势. 同时,两个典型站点发生突变的时间较接近.

    研究过程中发现,川滇农牧交错带极端降水强度有增大的趋势,且较短历时强降水事件增加更明显. 因此,川滇农牧交错带在未来极端降水指数保持上升趋势的情况下,对显著变化的站点须做深入研究,将极端降水强度指标与坡度、坡向、植被覆盖等因子相结合,综合分析该区域地貌灾害的致灾因子及等级. 另外,该区域由于地形复杂,降水具有典型的局地性特征,应在强降水事件高发区域增加雨量观测站的空间密度,使其观测数据更具代表性,以便更好地因地制宜实施防灾减灾措施,为当地农业生产服务.

Figure (7)  Table (1) Reference (26)

Catalog

    /

    DownLoad:  Full-Size Img  PowerPoint
    Return
    Return