Message Board

Dear readers, authors and reviewers,you can add a message on this page. We will reply to you as soon as possible!

2021 Volume 43 Issue 11
Article Contents

REN Binbin, WANG Ping, QIU Shaozhu, et al. Simulation of Spatial Distribution Characteristics of Precipitation in Hulunbuir City in 2018 and an Analysis of Interpolation Accuracy Based on Collaborative Kriging Model[J]. Journal of Southwest University Natural Science Edition, 2021, 43(11): 162-171. doi: 10.13718/j.cnki.xdzk.2021.11.019
Citation: REN Binbin, WANG Ping, QIU Shaozhu, et al. Simulation of Spatial Distribution Characteristics of Precipitation in Hulunbuir City in 2018 and an Analysis of Interpolation Accuracy Based on Collaborative Kriging Model[J]. Journal of Southwest University Natural Science Edition, 2021, 43(11): 162-171. doi: 10.13718/j.cnki.xdzk.2021.11.019

Simulation of Spatial Distribution Characteristics of Precipitation in Hulunbuir City in 2018 and an Analysis of Interpolation Accuracy Based on Collaborative Kriging Model

More Information
  • Received Date: 30/03/2021
    Available Online: 20/11/2021
  • MSC: P332.1

  • Precipitation data with high precision and spatio-temporal resolution are an important parameter in geoscience and related fields.Because of the strong randomness and poor continuity of rainfall, the spatial interpolation of precipitation has always been a focus and difficulty in the study of the spatialization of climatic factors.Hulunbuir city enjoys a vast area and is located in a semi-humid and semi-arid climate region, where rainfall is a key ecological factor and a scarce resource.Affected by the East Asia monsoon and topography, there are large spatio-temporal differences of precipitation in the region.Due to the scarcity of meteorological stations in the area, the spatial simulation of precipitation is of great significance.In the present study, based on the daily precipitation data, starting from January 1 to December 31, 2018, of 16 meteorological stations in Hulunbuir city, the Collaborative Kriging (Co-Kriging) Model is adopted to simulate the spatial distribution characteristics of annual and seasonal precipitations.On the basis of the relative errors (RE), which are calculated from the measured and predictive values, in precipitation at the test stations, the spatial interpolation accuracy of annual and seasonal precipitations is analyzed.Because of the randomness of rainfall and the influences of macro-geographical factors, such as longitude, latitude and altitude, the impacts on spatial interpolation accuracy of precipitation caused by precipitation frequency are analyzed.The results show that Co-Kriging method can describe the spatial differences of annual precipitation in Hulunbuir.From the east to the west of the region, the annual precipitation gradually decreases, approximately, from 750 mm to 220 mm.The annual precipitation isoline is roughly parallel to the northeast-southwest range of the Daxinganling Mountains.The annual precipitation occurs mostly in summer and autumn.The spatial distribution of precipitation in summer and autumn is similar to that of annual precipitation.When time resolution gets shorter, the accuracy of spatial interpolation of precipitation decreases, with the accuracy of the spatial interpolation of annual precipitation higher than that of the season.The ratio of the value of predictive annual precipitation to the measured value is close to 1 (p < 0.001), and the mean relative error (MRE) is small (11.4%).The accuracies of simulation of precipitation in the four seasons are listed in descending order as summer > autumn > spring > winter.The spatial interpolation accuracy of annual precipitation is positively correlated with precipitation frequency (p < 0.05), positively correlated with longitude (p < 0.001), and negatively correlated with altitude (p < 0.001).Similar to the accuracy of simulation of annual precipitation, the accuracy of spatial interpolation of precipitation in summer and autumn is correlated with longitude and altitude, namely that the more eastward, the higher is the interpolation accuracy; the higher the altitude, the lower is the interpolation accuracy.The precipitation frequency has a great impact on the simulation accuracy of spatial interpolation of precipitation in winter, spring and autumn.During the seasons with little rain, the "smoothing effect" caused by Co-Kriging model is obvious, which means that stations with large measured precipitation values have small predictive values, while stations with small measured precipitation values have large predictive values.The Co-Kriging model is more effective in spatially simulating annual and summer precipitation, and the spatial simulation of precipitation in other seasons needs further study.The present study can provide a reference for research on spatial interpolation of precipitation in areas with a scarcity of stations.
  • 加载中
  • [1] HIJMANS R J, CAMERON S E, PARRA J L, et al. Very High Resolution Interpolated Climate Surfaces for Global Land Areas [J]. International Journal of Climatology, 2005, 25(15): 1965-1978. doi: 10.1002/joc.1276

    CrossRef Google Scholar

    [2] ZHANG X K, LU X Y, WANG X D. Comparison of Spatial Interpolation Methods Based on Rain Gauges for Annual Precipitation on the Tibetan Plateau [J]. Polish Journal of Environmental Studies, 2016, 25(3): 1339-1345. doi: 10.15244/pjoes/61814

    CrossRef Google Scholar

    [3] CHEN D L, OU T H, GONG L B, et al. Spatial Interpolation of Daily Precipitation in China: 1951-2005 [J]. Advances in Atmospheric Sciences, 2010, 27(6): 1221-1232. doi: 10.1007/s00376-010-9151-y

    CrossRef Google Scholar

    [4] 于贵瑞, 何洪林, 刘新安, 等. 中国陆地生态信息空间化技术研究(Ⅰ)——气象/气候信息的空间化技术途径[J]. 自然资源学报, 2004, 19(4): 537-544. doi: 10.3321/j.issn:1000-3037.2004.04.017

    CrossRef Google Scholar

    [5] 刘新安, 于贵瑞, 范辽生, 等. 中国陆地生态信息空间化技术研究(Ⅲ)——温度、降水等气候要素[J]. 自然资源学报, 2004, 19(6): 818-825. doi: 10.3321/j.issn:1000-3037.2004.06.018

    CrossRef Google Scholar

    [6] 王江, 乐章燕, 廖荣伟, 等. 中国区域温度和降水不同空间插值方法精度对比[J]. 气象与环境学报, 2016, 32(6): 85-93. doi: 10.3969/j.issn.1673-503X.2016.06.011

    CrossRef Google Scholar

    [7] 朱会义, 刘述林, 贾绍凤. 自然地理要素空间插值的几个问题[J]. 地理研究, 2004, 23(4): 425-432. doi: 10.3321/j.issn:1000-0585.2004.04.001

    CrossRef Google Scholar

    [8] 辜智慧, 史培军, 陈晋. 气象观测站点稀疏地区的降水插值方法探讨——以锡林郭勒盟为例[J]. 北京师范大学学报(自然科学版), 2006, 42(2): 204-208. doi: 10.3321/j.issn:0476-0301.2006.02.022

    CrossRef Google Scholar

    [9] 阎洪. 薄板光顺样条插值与中国气候空间模拟[J]. 地理科学, 2004, 24(2): 163-169. doi: 10.3969/j.issn.1000-0690.2004.02.006

    CrossRef Google Scholar

    [10] ADHIKARY S K, MUTTIL N, YILMAZ A G. Cokriging for Enhanced Spatial Interpolation of Rainfall in Two Australian Catchments [J]. Hydrological Processes, 2017, 31(12): 2143-2161. doi: 10.1002/hyp.11163

    CrossRef Google Scholar

    [11] OZTURK D, KILIC F. Geostatistical Approach for Spatial Interpolation of Meteorological Data [J]. Anais Da Academia Brasileira De Ciências, 2016, 88(4): 2121-2136. doi: 10.1590/0001-3765201620150103

    CrossRef Google Scholar

    [12] 季漩, 罗毅. TRMM降水数据在中天山区域的精度评估分析[J]. 干旱区地理, 2013, 36(2): 253-262.

    Google Scholar

    [13] 岳文泽, 徐建华, 徐丽华. 基于地统计方法的气候要素空间插值研究[J]. 高原气象, 2005, 24(6): 974-980. doi: 10.3321/j.issn:1000-0534.2005.06.018

    CrossRef Google Scholar

    [14] 邬伦, 吴小娟, 肖晨超, 等. 五种常用降水量插值方法误差时空分布特征研究——以深圳市为例[J]. 地理与地理信息科学, 2010, 26(3): 19-24.

    Google Scholar

    [15] 孙然好, 刘清丽, 陈利顶. 基于地统计学方法的降水空间插值研究[J]. 水文, 2010, 30(1): 14-17, 58.

    Google Scholar

    [16] 赵煜飞, 朱江, 许艳. 近50a中国降水格点数据集的建立及质量评估[J]. 气象科学, 2014, 34(4): 414-420.

    Google Scholar

    [17] AHMED K, SHAHID S, HARUN S B. Spatial Interpolation of Climatic Variables in a Predominantly Arid Region with Complex Topography [J]. Environment Systems and Decisions, 2014, 34(4): 555-563. doi: 10.1007/s10669-014-9519-0

    CrossRef Google Scholar

    [18] 卓静, 朱延年. 秦岭主脊区年降水量空间插值最优方法研究[J]. 干旱区地理, 2017, 40(3): 555-563.

    Google Scholar

    [19] 马轩龙, 李春娥, 陈全功. 基于GIS的气象要素空间插值方法研究[J]. 草业科学, 2008, 25(11): 13-19. doi: 10.3969/j.issn.1001-0629.2008.11.003

    CrossRef Google Scholar

    [20] APAYDIN H, SONMEZ F K, YILDIRIM Y E. Spatial Interpolation Techniques for Climate Data in the GAP Region in Turkey [J]. Climate Research, 2004, 28: 31-40. doi: 10.3354/cr028031

    CrossRef Google Scholar

    [21] 陈雅婷, 刘奥博. 中国流域降水数据的空间插值方法评估[J]. 人民长江, 2019, 50(4): 100-105.

    Google Scholar

    [22] 蔡福, 于慧波, 矫玲玲, 等. 降水要素空间插值精度的比较——以东北地区为例[J]. 资源科学, 2006, 28(6): 73-79. doi: 10.3321/j.issn:1007-7588.2006.06.011

    CrossRef Google Scholar

    [23] 尚升海, 角媛梅, 刘澄静, 等. 哀牢山区降水时空变化及其阻隔效应研究[J]. 西南大学学报(自然科学版), 2019, 41(8): 92-98.

    Google Scholar

    [24] 符静, 旷微, 邓运员, 等. 湖南省近56年降水变化趋势及空间特征[J]. 西南大学学报(自然科学版), 2021, 43(2): 110-119.

    Google Scholar

    [25] 何红艳, 郭志华, 肖文发. 降水空间插值技术的研究进展[J]. 生态学杂志, 2005, 24(10): 1187-1191. doi: 10.3321/j.issn:1000-4890.2005.10.016

    CrossRef Google Scholar

    [26] 胡庆芳. 基于多源信息的降水空间估计及其水文应用研究[D]. 北京: 清华大学, 2013.

    Google Scholar

    [27] 张唯, 龙亚斐, 张剑波, 等. 融合时序特征的湖北省降水空间分布估算[J]. 长江流域资源与环境, 2014, 23(10): 1398-1405. doi: 10.11870/cjlyzyyhj201410009

    CrossRef Google Scholar

    [28] 卞薇, 陈亚宁, 李稚, 等. 不同源降水数据在天山南坡阿克苏河流域适用性分析[J]. 干旱区地理, 2018, 41(3): 459-471.

    Google Scholar

    [29] GOOVAERTS P. Geostatistical Approaches for Incorporating Elevation into the Spatial Interpolation of Rainfall [J]. Journal of Hydrology, 2000, 228(1-2): 113-129. doi: 10.1016/S0022-1694(00)00144-X

    CrossRef Google Scholar

    [30] 石朋, 芮孝芳. 降雨空间插值方法的比较与改进[J]. 河海大学学报(自然科学版), 2005, 33(4): 361-365. doi: 10.3321/j.issn:1000-1980.2005.04.002

    CrossRef Google Scholar

    [31] 徐天献, 王玉宽, 傅斌. 四川省降水空间分布的插值分析[J]. 人民长江, 2010, 41(10): 9-12.

    Google Scholar

    [32] 虎雄岗, 谈树成, 金艳珠, 等. 基于地形高程的云南省降雨量空间插值方法研究[J]. 热带地理, 2012, 32(4): 370-377. doi: 10.3969/j.issn.1001-5221.2012.04.007

    CrossRef Google Scholar

    [33] 蒋育昊, 刘鹏举, 夏智武, 等. 站点密度对复杂地形PRISM月降雨空间插值精度的影响[J]. 南京林业大学学报(自然科学版), 2017, 41(4): 115-120.

    Google Scholar

    [34] 朱会义, 贾绍凤. 降雨信息空间插值的不确定性分析[J]. 地理科学进展, 2004, 23(2): 34-42.

    Google Scholar

    [35] 舒守娟, 王元, 熊安元. 中国区域地理、地形因子对降水分布影响的估算和分析[J]. 地球物理学报, 2007, 50(6): 1703-1712.

    Google Scholar

    [36] 穆兴民, 陈国良. 黄土高原降水与地理因素的空间结构趋势面分析[J]. 干旱区地理, 1993, 16(2): 71-76.

    Google Scholar

    [37] 李军, 杨青, 史玉光. 基于DEM的新疆降水量空间分布[J]. 干旱区地理, 2010, 33(6): 868-873.

    Google Scholar

    [38] 高瑞睿, 李雪梅, 高培. 地形异质性对天山山区气候的影响分析[J]. 干旱区地理, 2017, 40(1): 197-203.

    Google Scholar

    [39] 蒲阳, 王汝兰, 罗明良, 等. 不同雨量次降雨空间插值对比——以四川省南充市降雨为例[J]. 水文, 2018, 38(4): 73-77.

    Google Scholar

  • 加载中
通讯作者: 陈斌, bchen63@163.com
  • 1. 

    沈阳化工大学材料科学与工程学院 沈阳 110142

  1. 本站搜索
  2. 百度学术搜索
  3. 万方数据库搜索
  4. CNKI搜索

Figures(6)  /  Tables(1)

Article Metrics

Article views(1420) PDF downloads(143) Cited by(0)

Access History

Other Articles By Authors

Simulation of Spatial Distribution Characteristics of Precipitation in Hulunbuir City in 2018 and an Analysis of Interpolation Accuracy Based on Collaborative Kriging Model

Abstract: Precipitation data with high precision and spatio-temporal resolution are an important parameter in geoscience and related fields.Because of the strong randomness and poor continuity of rainfall, the spatial interpolation of precipitation has always been a focus and difficulty in the study of the spatialization of climatic factors.Hulunbuir city enjoys a vast area and is located in a semi-humid and semi-arid climate region, where rainfall is a key ecological factor and a scarce resource.Affected by the East Asia monsoon and topography, there are large spatio-temporal differences of precipitation in the region.Due to the scarcity of meteorological stations in the area, the spatial simulation of precipitation is of great significance.In the present study, based on the daily precipitation data, starting from January 1 to December 31, 2018, of 16 meteorological stations in Hulunbuir city, the Collaborative Kriging (Co-Kriging) Model is adopted to simulate the spatial distribution characteristics of annual and seasonal precipitations.On the basis of the relative errors (RE), which are calculated from the measured and predictive values, in precipitation at the test stations, the spatial interpolation accuracy of annual and seasonal precipitations is analyzed.Because of the randomness of rainfall and the influences of macro-geographical factors, such as longitude, latitude and altitude, the impacts on spatial interpolation accuracy of precipitation caused by precipitation frequency are analyzed.The results show that Co-Kriging method can describe the spatial differences of annual precipitation in Hulunbuir.From the east to the west of the region, the annual precipitation gradually decreases, approximately, from 750 mm to 220 mm.The annual precipitation isoline is roughly parallel to the northeast-southwest range of the Daxinganling Mountains.The annual precipitation occurs mostly in summer and autumn.The spatial distribution of precipitation in summer and autumn is similar to that of annual precipitation.When time resolution gets shorter, the accuracy of spatial interpolation of precipitation decreases, with the accuracy of the spatial interpolation of annual precipitation higher than that of the season.The ratio of the value of predictive annual precipitation to the measured value is close to 1 (p < 0.001), and the mean relative error (MRE) is small (11.4%).The accuracies of simulation of precipitation in the four seasons are listed in descending order as summer > autumn > spring > winter.The spatial interpolation accuracy of annual precipitation is positively correlated with precipitation frequency (p < 0.05), positively correlated with longitude (p < 0.001), and negatively correlated with altitude (p < 0.001).Similar to the accuracy of simulation of annual precipitation, the accuracy of spatial interpolation of precipitation in summer and autumn is correlated with longitude and altitude, namely that the more eastward, the higher is the interpolation accuracy; the higher the altitude, the lower is the interpolation accuracy.The precipitation frequency has a great impact on the simulation accuracy of spatial interpolation of precipitation in winter, spring and autumn.During the seasons with little rain, the "smoothing effect" caused by Co-Kriging model is obvious, which means that stations with large measured precipitation values have small predictive values, while stations with small measured precipitation values have large predictive values.The Co-Kriging model is more effective in spatially simulating annual and summer precipitation, and the spatial simulation of precipitation in other seasons needs further study.The present study can provide a reference for research on spatial interpolation of precipitation in areas with a scarcity of stations.

  • 开放科学(资源服务)标识码(OSID):

  • 具有高分辨率、空间信息化的降水数据是地球科学、气候学、生态学等相关研究的重要参数[1-5].因地面气象站点的离散性,气候空间模拟成为陆地生态信息空间化研究的重点[4].于贵瑞等[4]从理论和技术层面上提出构建国家尺度、高分辨率栅格化气候信息数据库的基本思路和途径.针对气候要素空间插值算法理论[1-2, 4-9]、精度[4, 6, 8, 10-22]的研究较多,目前常用的降水空间插值法有反距离权重、趋势面、克里金、样条函数、多元回归等10余种[23-26],且有不同的分类[25-26].随着降水机理研究的深入,根据实测降水信息及位置、地形等影响因素进行的空间估计,理论上更加完善[26-27].为获取连续的高精度、高时空分辨率降水数据,在考虑各种降水影响因子的前提下,多源降水信息的融合及多种插值方法的混合使用已成为必然趋势[8, 12, 25],但多源降水信息融合的应用目前仍存在许多不足[28].在引入辅助变量插值时,协同克里格法(Co-kriging)有更大的优势[2, 6, 10, 15, 27, 29-32].

    降水属于概率事件,随机性强,与其他气候要素相比,降水空间模拟精度一直倍受关注.除插值方法外,测站数量[19]、分布密度[5, 16, 33]、海陆距离及海拔等宏观地理因子[7, 31, 34-37]、微地形因子[33, 35, 38]、时间分辨率[34]、降水强度[39]等因素也是影响降水空间插值精度的重要因素.研究表明,测站密度越小、气候要素时间连续性越差(如降水),空间化误差越大,冬季误差大于夏季[5].时间分辨率越高,降水空间插值的不确定性越大[34].目前,针对降水概率对降水量空间插值精度的影响,且以实测站点进行验证的研究较少.

    内蒙古呼伦贝尔市地域辽阔,地处温带半湿润、半干旱气候区,降水是该区域关键的生态因子和稀缺资源,采用协同克里金(Co-kriging)法进行降水量空间插值,分析该市降水量空间分布特征,探讨降水量插值精度及其影响因素,旨在为呼伦贝尔市及类似地区开展降水量时空动态、水文调控及水资源管理、旱涝灾害监测与评估、农牧业生产指导等,提供高精度降水空间数据及方法参考.

1.   研究区概况及方法
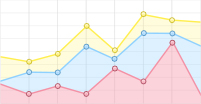
  • 呼伦贝尔市(47°05′~53°20′ N、115°31′~126°04′ E)位于内蒙古自治区东北部,东邻黑龙江,南连兴安盟,北、西北接壤俄罗斯,西、西南接壤蒙古国(图 1).大兴安岭斜贯中部(东北—西南),向东陡降至嫩江平原边缘,向西缓倾至呼伦贝尔高原,海拔约200~1 700 m.呼伦贝尔市以温带大陆性季风气候为主,多年(1961-2018年)气象数据显示,年均温-4.4~3.3 ℃,西南、东南部显著高于中北部山区;年降水量235.6~538.3 mm,东多西少.岭东属嫩江流域,有甘河、诺敏河等嫩江支流,岭西属额尔古纳河流域,主要河、湖有额尔古纳河、海拉尔河、伊敏河及呼伦湖、贝尔湖等.大兴安岭植被以寒温性针叶林(兴安落叶松、樟子松林)为主,兼有蒙古栎、杨、桦落叶阔叶林等;呼伦贝尔高原植被以草原为主,其次为灌丛和草甸等;土壤有灰色森林土、棕色针叶土、暗棕壤、黑钙土、栗钙土等.

  • 2018年之前,乡镇自动气象站监测数据不完整,故选择2018年降水观测记录连续性较好的125个乡镇自动气象站作为检测站点,用于插值精度检验.用于空间插值的降水量数据来源于呼伦贝尔市境内的16个国家气象站(图 1)2018年1月1日至12月31日地面站逐日降水量实测数据,分别对年、季降水量空间分布特征进行模拟.

    采用Arcmap 10.2中Co-kriging插值模型,考虑地形因素对降水的影响[34],以国家气象站位置(经、纬度)和DEM(分辨率90 m)为协同变量,进行空间插值,模拟呼伦贝尔市年、季降水量时空变化特征.根据检测站位置,“按点提取”各检测站降水量预测值,依据预测值、实测值比值、相关系数以及相对误差(RE)和平均相对误差(MRE)分析降水量空间插值精度.REMRE计算公式[18, 22, 34]如下:

    式中,xi为第i个站降水量的实测值,xi为第i个站降水量的预测值,n为检测站数目.RE为站点相对误差值,MREn个站点相对误差的平均值.

    以实际降水频率(某一时段内有效降水日数占该时段总日数的比例)大小表示降水概率差异.采用线性回归分析年、季降水量空间插值相对误差值与降水频率及宏观地理因子(经度、纬度、海拔)的关系.

2.   结果与分析
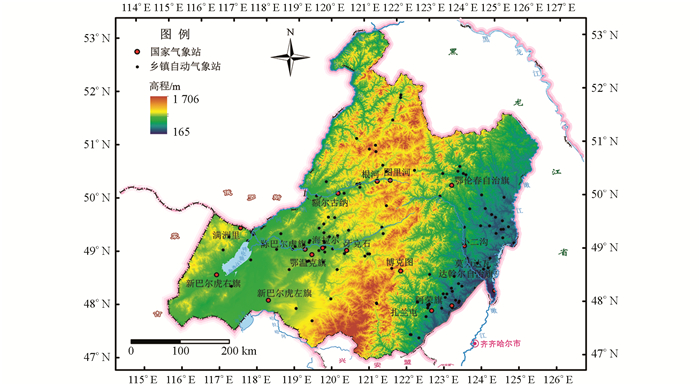
  • Co-kriging插值结果显示,受季风环流和地形的共同影响,自东向西,呼伦贝尔市2018年年降水量从750 mm左右逐渐降低至220 mm左右,等降水量线延伸方向与大兴安岭走向基本一致,岭东(550~750 mm)显著高于岭西(220~400 mm).2018年年降水量实测值东部最多(阿荣旗765.8 mm),且大于该站多年(1961-2018年)平均年降水量(473.3 mm),西部最少(新巴尔虎右旗224 mm),且小于该站多年(1961-2018年)平均年降水量(235.6 mm),表明该区域2018年年降水量空间差异大于1961年以来的平均模态.除新巴尔虎右旗、陈巴尔虎旗、额尔古纳等少数站点外,多数站点年降水量实测值高于自1961年以来的年降水量平均值,即2018年为多水年(图 2).

    降水量季节分配十分悬殊,冬季(约4.5~6 mm)、春季(约35~60 mm)稀少,夏季丰富(约200~500 mm),70% 以上的降水发生在夏季,秋季较多(约30~120 mm).各季降水量空间分布不均匀(图 3),降水量空间分布差异大小与季节降水量多少有关,多雨区与少雨区降水量之比从大到小依次为秋(4.0)、夏(2.5)、春(1.7)、冬(1.5).春季降水量自南向北递减(图 3a).夏季降水量由东向西显著递减(图 3b),西南新巴尔虎右旗降水量最少,少于200 mm,东南阿荣旗最多,超过600 mm.秋季降水量自东向西显著减小,岭东降水量偏多,尤以大兴安岭东坡最多(博克图121.7 mm、根河139.1 mm、图里河124.5 mm);岭西高原降水量较少,少于80 mm,新巴尔虎右旗降水最少(22.2 mm)(图 3c).冬季降水量最少,空间分布差异亦最小,北及东北部偏多,额尔古纳以东,图里河、鄂伦春均超过6 mm,西南小于5.5 mm,新巴尔虎右旗最少(2.0 mm)(图 3d).

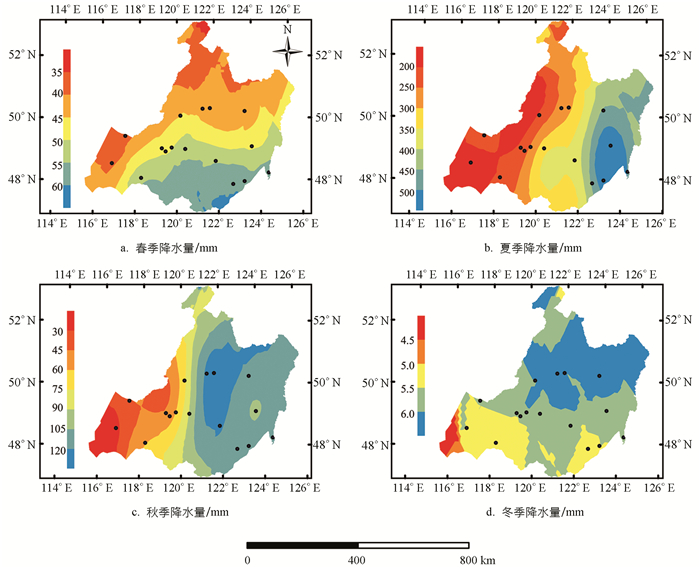
    降水量空间分布季节性变化特征主要与东亚季风西伸北进、暖湿气团的季节位移有关.冬、春季降水量较少,降水主要发生在夏、秋季,因此夏、秋季降水量与年降水量空间分布特征相似,均大致表现为自东向西减少的趋势.

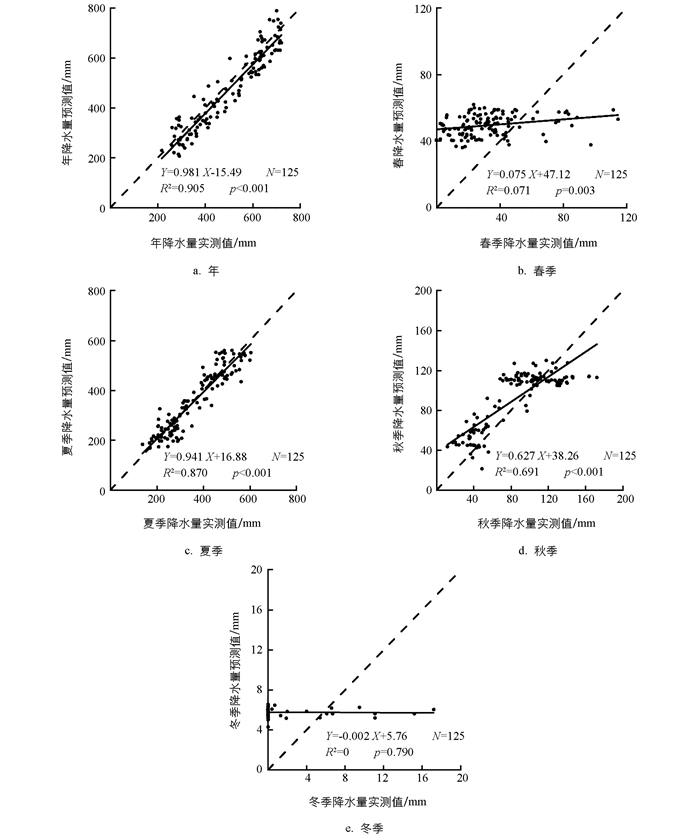
  • 检测站点预测值与实测值分析结果显示,年、夏季降水量预测值与实测值比值分别为0.981,0.942,均接近1(p<0.001),相关系数前者(0.951)略大于后者(0.933),表明空间插值精度年降水量最高,其次为夏季降水量.春、秋季降水量预测值与实测值之比分别为0.075(p=0.003),0.627(p<0.001).春季大部分站点降水量实测值小于预测值,少数站点降水量实测值大于预测值.冬季降水量模拟误差最大,多数站点实测值(0 mm)小于预测值,RE>100%,说明冬季有效降水日数少、降水频率小、随机性强.与已有结论相似[5, 37],降水量空间插值精度表现为年大于季,夏、秋季大于冬、春季.降水量小的季节(春、秋、冬),空间插值法所产生的“平滑效应”明显,即降水量小的站点,预测值大于实测值,降水量大的站点,预测值小于实测值(图 4).

    因冬、春、秋季RE较大,故年降水量MRE(11.4%)略大于夏季MRE(10.7%)(表 1).冬、春、秋季降水量相对误差大的检测站点较多,RE超过100% 的站点数分别为115,55,7,降水空间插值不确定性较大.

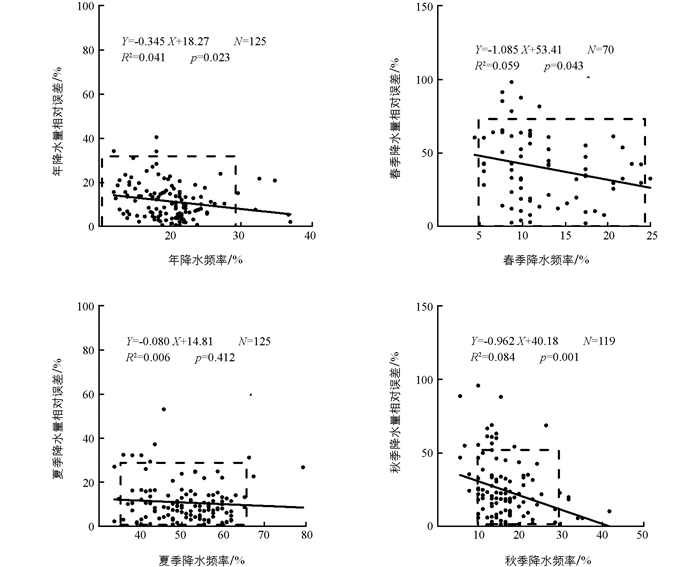
  • 年降水量相对误差最小(RE约0~40%),夏季降水量相对误差(RE约0~60%)次之,春、秋季降水量相对误差较大(部分站点RE>100%),冬季降水量相对误差最大,90%以上站点冬季降水频率为0,RE>100%,降水频率与相对误差相关性分析不具有代表性(故未显示).降水频率与相对误差相关分析表明(图 5),年降水频率与相对误差呈负相关(p=0.023),说明年降水频率越大,相对误差越小,降水量空间插值精度越高.多数站点年降水频率为10%~30%,RE为0~30%.剔除RE>100% 的站点(55个),春季降水频率与相对误差呈负相关(p=0.043).多数站点春季降水频率为5%~25%,RE为0~60%.夏季降水频率最大,多数站点降水频率约35%~65%,RE为0~30%,但夏季降水频率与降水量相对误差无显著相关性(p=0.412),说明影响夏季降水空间插值精度的因素不只是降水频率,可能与有效雨日内降水量多少有关.多数站点秋季降水频率为10%~30%,RE为0~50%,降水频率与降水量相对误差呈显著负相关(p=0.001).

  • 检测站点降水量相对误差与经度、纬度、海拔相关性见图 6.

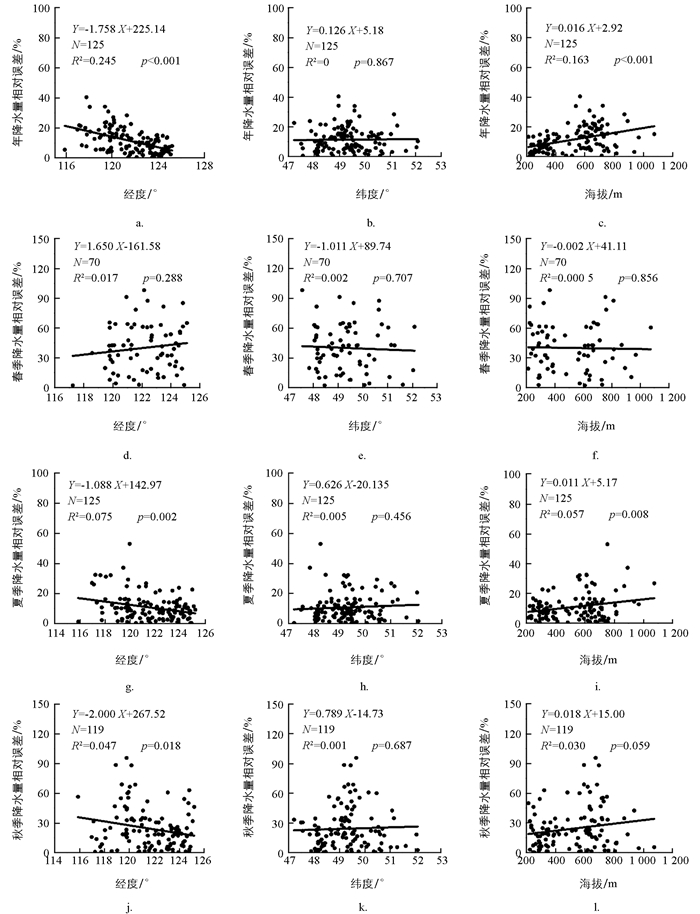
    受季风环流和大兴安岭山地的共同影响,岭东降水频率及降水量大于岭西,且差异有统计学意义,指示降水过程与宏观地理因子有关.宏观地理因子对降水量空间插值精度的影响存在年、季差异,年、季降水量插值精度与纬度相关性较弱(p>0.10),与经度和海拔相关性较强.经度对年、夏季、秋季降水量空间插值精度影响类似,海拔亦然,说明年降水量多少主要取决于夏、秋季降水量的贡献,年、夏季、秋季降水量空间插值精度与湿气团来源、方向及中部山地阻滞有关.年降水量空间插值相对误差与经度呈极显著负相关(p<0.001),与海拔呈极显著正相关(p<0.001),即越向东,年降水概率越大、降水量越多,空间插值相对误差越小、精度越高;海拔越高,年降水量空间插值相对误差越大、精度越低.与之相似,夏季降水量空间插值相对误差与经度呈显著负相关(p=0.002),与海拔呈显著正相关(p=0.008).秋季降水量空间插值相对误差与经度负相关性较弱(p=0.018).冬、春季降水量空间插值相对误差大,主要是降水频率低、强度小所致.

3.   结论与讨论
  • (1) Co-kriging模拟结果显示,年降水量空间分布及季节动态能够明确指示水汽来源、季风方向以及季风环流对该区域降水过程的影响,突出了降水空间分布受地形影响的显著性,符合降水发生机理.等年降水量线延伸方向与大兴安岭走向基本一致,岭东受夏季风影响明显,降水量偏多,岭西所受影响较小,降水量较少.降水量多少季节差异悬殊,夏、秋季多,冬、春季少.与年降水量空间分布特征相似,夏、秋季降水量呈自东向西递减趋势.

    (2) 降水量空间插值不确定性随时间分辨率的提高而增加,降水量插值精度年大于季.四季降水量空间插值精度则为夏、秋季大于冬、春季.年、夏季降水量预测值与实测值之比近于1(p<0.001),空间插值精度较高,次之为秋季,冬、春季降水量小,随机性强,相对误差大、空间插值精度低.说明该区域降水量空间插值精度与降水量多少有关,年、夏季降水量空间模拟更可靠.冬、春季降水量空间插值方法有待改进.

    (3) 一般认为降水量大,降水频次就多,本研究显示降水频率对年、春、秋、冬季降水量空间插值精度影响较大,对夏季降水量插值精度影响较小,可能与夏季有效雨日内雨量大小有关.宏观地理因子对降水量插值精度的影响存在年、季差异.年、夏、秋季降水量空间插值精度均随经度增加(向东)而提高,随海拔升高而降低,说明夏季风影响下,距水汽源地越近、降水越多的地方降水量空间插值精度越高.海拔越高、受坡向、风向、湿气团水汽含量等因素影响越复杂,降水量空间插值精度不确定性越大.

Figure (6)  Table (1) Reference (39)

Catalog

    /

    DownLoad:  Full-Size Img  PowerPoint
    Return
    Return