Message Board

Dear readers, authors and reviewers,you can add a message on this page. We will reply to you as soon as possible!

2024 Volume 46 Issue 10
Article Contents

WANG Jiajin, WANG Hao, WANG Chunxue, et al. Refined Characteristics of Hourly Extreme Precipitation in Sichuan Province during Flood Season[J]. Journal of Southwest University Natural Science Edition, 2024, 46(10): 167-176. doi: 10.13718/j.cnki.xdzk.2024.10.014
Citation: WANG Jiajin, WANG Hao, WANG Chunxue, et al. Refined Characteristics of Hourly Extreme Precipitation in Sichuan Province during Flood Season[J]. Journal of Southwest University Natural Science Edition, 2024, 46(10): 167-176. doi: 10.13718/j.cnki.xdzk.2024.10.014

Refined Characteristics of Hourly Extreme Precipitation in Sichuan Province during Flood Season

More Information
  • Corresponding author: WANG Chunxue ; 
  • Received Date: 27/12/2023
    Available Online: 20/10/2024
  • MSC: P426.6

  • The refined characteristics of hourly extreme precipitation were analyzed using hourly precipitation data of 2 895 meteorological stations in Sichuan Province from May to September from 2012 to 2021. The results show that hourly precipitation in Sichuan Province during the flood season showed a transitional change at the 99th percentile, and the hourly extreme precipitation threshold decreased with the increase of altitude. The contribution rate of hourly extreme precipitation was the highest in the Sichuan Basin, followed by Panxi region, and the lowest in the western Sichuan Plateau, which basically matched with the amount of precipitation during the flood season. In the past 10 years, the contribution rate of hourly extreme precipitation in flood season in each region was mainly increasing, especially significant in the western Sichuan Plateau and Panzhi region, but with very large spatial variations. During the day, the hourly extreme precipitation in all regions showed a "single-peak" pattern, with a relatively greater probability of hourly extreme precipitation occurring at night. The peak time varied from region to region, and hourly extreme precipitation was less likely to occur in the midday. Hourly extreme precipitation has shown a trend of higher peak and lower valley over the last 10 years. The hourly extreme precipitation process peaked quickly and weakened slowly, and the later the start time, the longer the duration. The Sichuan Basin and southwestern Sichuan mountainous areas had a short duration of 1-3 hours from the afternoon to the first half of the night, and a continuous duration of 3-11 hours in the second half of the night. Moreover, the southwestern Sichuan mountainous areas had a slightly later onset and longer duration.

  • 加载中
  • [1] DONAT M G, LOWRY A L, ALEXANDER L V, et al. More Extreme Precipitation in the World's Dry and Wet Regions[J]. Nature Climate Change, 2016(6): 508-513.

    Google Scholar

    [2] WESTRA S, FOWLER H J, EVANS J P, et al. Future Changes to the Intensity and Frequency of Short-Duration Extreme Rainfall[J]. Reviews of Geophysics, 2014, 52(3): 522-555. doi: 10.1002/2014RG000464

    CrossRef Google Scholar

    [3] 毛冬艳, 曹艳察, 朱文剑, 等. 西南地区短时强降水的气候特征分析[J]. 气象, 2018, 44(8): 1042-1050.

    Google Scholar

    [4] 陈博宇, 谌芸, 孙继松, 等. 诱发四川冕宁"6. 26" 山洪灾害的突发性暴雨特征及其形成机制[J]. 大气科学, 2023, 47(1): 1-19.

    Google Scholar

    [5] 齐铎, 崔晓鹏, 邹强利. 2020年"6·26"冕宁致灾暴雨成因观测分析[J]. 大气科学, 2023, 47(2): 585-598.

    Google Scholar

    [6] 孙跃, 肖辉, 杨慧玲, 等. 基于遥感数据光流场的2021年郑州"7·20" 特大暴雨动力条件和水凝物输送特征分析[J]. 大气科学, 2021, 45(6): 1384-1399.

    Google Scholar

    [7] 潘元贵, 伍中庚, 孙东, 等. 四川渠县"8·8" 特大暴雨引发的地质灾害分布特征与成因分析[J]. 中国地质灾害与防治学报, 2022, 33(4): 125-133.

    Google Scholar

    [8] 李建, 宇如聪, 孙溦. 中国大陆地区小时极端降水阈值的计算与分析[J]. 暴雨灾害, 2013, 32(1): 11-16.

    Google Scholar

    [9] 彭芳, 吴古会, 杜小玲. 贵州省汛期短时降水时空特征分析[J]. 气象, 2012, 38(3): 307-313.

    Google Scholar

    [10] 蔡新玲, 叶殿秀, 孙娴, 等. 1961-2011年陕西省汛期短时降水变化特征[J]. 高原气象, 2014, 33(6): 1618-1626.

    Google Scholar

    [11] LIANG P, DING Y H. The Long-Term Variation of Extreme Heavy Precipitation and Its Link to Urbanization Effects in Shanghai during 1916-2014[J]. Advances in Atmospheric Sciences, 2017, 34(3): 321-334. doi: 10.1007/s00376-016-6120-0

    CrossRef Google Scholar

    [12] 董旭光, 顾伟宗, 曹洁, 等. 山东省汛期小时极端强降水分布和变化特征[J]. 气象, 2017, 43(8): 953-961.

    Google Scholar

    [13] 杨霞, 周鸿奎, 赵克明, 等. 1991-2018年新疆夏季小时极端强降水特征[J]. 高原气象, 2020, 39(4): 762-773.

    Google Scholar

    [14] 温克刚, 詹兆渝. 中国气象灾害大典-四川卷[M]. 北京: 气象出版社, 2006.

    Google Scholar

    [15] 鲍名, 黄荣辉. 近40年我国暴雨的年代际变化特征[J]. 大气科学, 2006, 30(6): 1057-1067.

    Google Scholar

    [16] MAI Z, FU S M, SUN J H, et al. Key Statistical Characteristics of the Mesoscale Convective Systems Generated over the Tibetan Plateau and Their Relationship to Precipitation and Southwest Vortices[J]. International Journal of Climatology, 2020, 41: 875-896.

    Google Scholar

    [17] 孙建华, 李娟, 沈新勇, 等. 2013年7月四川盆地一次特大暴雨的中尺度系统演变特征[J]. 气象, 2015, 41(5): 533-543.

    Google Scholar

    [18] HUANG Y J, CUI X P. Moisture Sources of an Extreme Precipitation Event in Sichuan, China, Based on the Lagrangian Method[J]. Atmospheric Science Letters, 2015, 16(2): 177-183.

    Google Scholar

    [19] HU X L, YUAN W H, YU R C, et al. The Evolution Process of Warm Season Intense Regional Rainfall Events in Yaan[J]. Climate Dynamics, 2020, 54(7): 3245-3258.

    Google Scholar

    [20] 董欣, 倪相. 西南地区不同海拔极端降水时空变化特征[J]. 西南大学学报(自然科学版), 2022, 44(9): 110-121.

    Google Scholar

    [21] 薛雨婷, 李谢辉, 王磊, 等. 1976-2017年西南地区夏季不同等级降水时空变化特征[J]. 西南大学学报(自然科学版), 2022, 44(2): 137-145.

    Google Scholar

    [22] 周秋雪, 刘莹, 冯良敏, 等. 2008-2012年四川强小时雨强的时空分布特征[J]. 高原气象, 2015, 34(5): 1261-1269.

    Google Scholar

    [23] 王彬雁, 赵琳娜, 许晖, 等. 四川雨季小时降水的概率分布特征及其降水分区[J]. 暴雨灾害, 2018, 37(2): 115-123.

    Google Scholar

    [24] 邓彪, 王春学, 孙蕊, 等. 四川省近10年极端小时降水时空分布特征[J]. 高原山地气象研究, 2022, 42(4): 115-120.

    Google Scholar

    [25] LUO Y L, WU M W, REN F M, et al. Synoptic Situations of Extreme Hourly Precipitation over China[J]. Journal of Climate, 2016, 29(24): 8703-8719.

    Google Scholar

    [26] 邓国卫, 孙俊, 阮贵宾, 等. 四川省暴雨洪涝灾情特征及主汛期环流背景分析[J]. 高原气象, 2017, 36(6): 1521-1532.

    Google Scholar

    [27] TANG C, ZHU J, LI W L, et al. Rainfall-Triggered Debris Flows Following the Wenchuan Earthquake[J]. Bulletin of Engineering Geology and the Environment, 2009, 68(2): 187-194.

    Google Scholar

    [28] 崔鹏, 陈晓清, 张建强, 等. "4·20" 芦山7.0级地震次生山地灾害活动特征与趋势[J]. 山地学报, 2013, 31(3): 257-265.

    Google Scholar

    [29] 任芝花, 赵平, 张强, 等. 适用于全国自动站小时降水资料的质量控制方法[J]. 气象, 2010, 36(7): 123-132.

    Google Scholar

    [30] LI J, YU R C, SUN W. Duration and Seasonality of Hourly Extreme Rainfall in the Central Eastern China[J]. Acta Meteorologica Sinica, 2013, 27(6): 799-807.

    Google Scholar

    [31] WU M W, WU C C, YEN T H, et al. Synoptic Analysis of Extreme Hourly Precipitation in Taiwan during 2003-12[J]. Monthly Weather Review, 2017, 145(12): 5123-5140.

    Google Scholar

    [32] ZHAI P M, ZHANG X B, WAN H, et al. Trends in Total Precipitation and Frequency of Daily Precipitation Extremes over China[J]. Journal of Climate, 2005, 18(7): 1096-1108.

    Google Scholar

    [33] 施能, 黄先香, 杨扬. 1948-2000年全球陆地年降水量场趋势变化的时、空特征[J]. 大气科学, 2003, 27(6): 971-982.

    Google Scholar

    [34] ZHANG H, ZHAI P M. Temporal and Spatial Characteristics of Extreme Hourly Precipitation over Eastern China in the Warm Season[J]. Advances in Atmospheric Sciences, 2011, 28(5): 1177-1183.

    Google Scholar

    [35] WANG Y Q, ZHOU L. Observed Trends in Extreme Precipitation Events in China during 1961-2001 and the Associated Changes in Large-Scale Circulation[J]. Geophysical Research Letters, 2005, 32(9): L09707.

    Google Scholar

  • 加载中
通讯作者: 陈斌, bchen63@163.com
  • 1. 

    沈阳化工大学材料科学与工程学院 沈阳 110142

  1. 本站搜索
  2. 百度学术搜索
  3. 万方数据库搜索
  4. CNKI搜索

Figures(9)  /  Tables(1)

Article Metrics

Article views(4904) PDF downloads(388) Cited by(0)

Access History

Other Articles By Authors

Refined Characteristics of Hourly Extreme Precipitation in Sichuan Province during Flood Season

    Corresponding author: WANG Chunxue ; 

Abstract: 

The refined characteristics of hourly extreme precipitation were analyzed using hourly precipitation data of 2 895 meteorological stations in Sichuan Province from May to September from 2012 to 2021. The results show that hourly precipitation in Sichuan Province during the flood season showed a transitional change at the 99th percentile, and the hourly extreme precipitation threshold decreased with the increase of altitude. The contribution rate of hourly extreme precipitation was the highest in the Sichuan Basin, followed by Panxi region, and the lowest in the western Sichuan Plateau, which basically matched with the amount of precipitation during the flood season. In the past 10 years, the contribution rate of hourly extreme precipitation in flood season in each region was mainly increasing, especially significant in the western Sichuan Plateau and Panzhi region, but with very large spatial variations. During the day, the hourly extreme precipitation in all regions showed a "single-peak" pattern, with a relatively greater probability of hourly extreme precipitation occurring at night. The peak time varied from region to region, and hourly extreme precipitation was less likely to occur in the midday. Hourly extreme precipitation has shown a trend of higher peak and lower valley over the last 10 years. The hourly extreme precipitation process peaked quickly and weakened slowly, and the later the start time, the longer the duration. The Sichuan Basin and southwestern Sichuan mountainous areas had a short duration of 1-3 hours from the afternoon to the first half of the night, and a continuous duration of 3-11 hours in the second half of the night. Moreover, the southwestern Sichuan mountainous areas had a slightly later onset and longer duration.

  • 开放科学(资源服务)标识码(OSID):

  • 全球变暖背景下极端降水事件频发[1], 尤其小时极端降水的增加趋势更加显著[2]. 统计显示, 强对流天气是仅次于暴雨洪涝的第二大类气象灾害, 由短时强降水引发的山洪、城市渍涝和地质灾害屡见不鲜, 对人民生命财产造成重大威胁[3]. 如2020年四川冕宁“6.26”突发性暴雨, 最大小时雨量达69.3 mm, 引发山洪灾害, 造成重大人员伤亡[4-5]. 2021年河南郑州“7.20”特大暴雨, 最大小时雨量达201.9 mm, 引发了严重城市内涝, 造成巨大人员伤亡和财产损失[6]. 2021年四川渠县“8.8”特大暴雨, 最大小时雨量达121.3 mm, 导致县内新增地质灾害隐患点38处, 4.3万余人受灾[7]. 近年来, 小时极端降水受到广泛关注, 李建等[8]使用中国465个气象站资料研究了中国小时极端降水阈值, 发现利用百分位法和广义极值分布确定的阈值空间分布较为一致. 一些研究还涉及贵州[9]、陕西[10]、上海[11]、山东[12]和新疆[13]等地, 大都利用国家气象站资料, 采用百分位法, 分析了当地小时极端降水的阈值、日变化以及变化趋势等特征.

    四川省地处中国西南部, 地形复杂多样, 主要包括四川盆地、川西高原和攀西地区三大区域, 受东亚季风、南亚季风和高原季风共同影响, 是中国气象灾害的高发区, 尤其强降水引发的地质灾害更为突出[14]. 四川省是我国典型的暴雨多发区之一, 已有大量研究关注到该地区的强降水特征及其形成机理[15-21], 但有关四川省小时极端降水的研究还比较少, 周秋雪等[22]使用1 052个气象站资料, 采用固定阈值法分析了2008-2012年四川省小时降水特征;王彬雁等[23]使用157个气象站资料, 采用概率分布模型, 计算了2010-2016年四川省最大小时降水量的概率分布和重现期;邓彪等[24]使用156个气象站资料, 采用百分位法, 研究了2012-2020年四川省小时极端降水时空分布特征.

    小时极端降水前期天气尺度征兆弱、雨强大、强降水时段集中、破坏性强[25], 容易导致四川盆地出现城市内涝[26], 另外川西高原和攀西地区山脉河谷纵横、土质松散, 小时极端降水极易引发山洪、泥石流等次生灾害[27-28]. 掌握四川省小时极端降水的精细时空变化规律, 可增强对复杂地形地区小时强降水的科学认识, 对提高预报准确率、增强气象防灾减灾能力具有重要意义. 本研究利用四川省2 985个气象站点2012-2021年气象资料, 从多尺度时空角度分析四川省小时极端降水的精细化特征.

1.   资料与方法
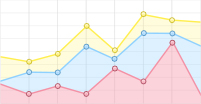
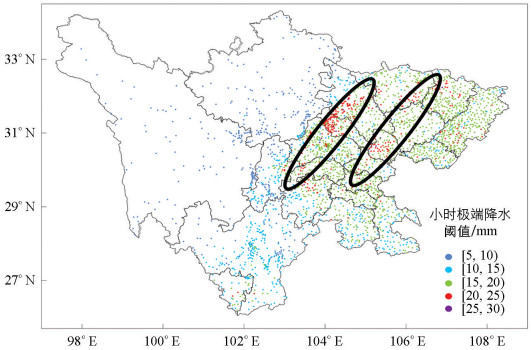
  • 本研究使用了四川省气象数据探测中心提供的2012-2021年汛期(5-9月)四川省2 985个气象站的小时降水量资料(包括156个国家气象站和2 829个省级气象站), 站点分布如图 1所示. 采用气候极值检测和空间一致性检测方法[29], 对省级气象站小时降水量资料进行了质量控制.

  • 当前使用较为广泛的极端降水阈值确定方法有两种, 一种是基于极值理论的参数估计[30-31], 另一种是百分位法[32-33]. 由于降水本身具有很强的空间不均匀性, 极端降水阈值不宜采用固定值, 所以本研究使用了国际上广泛应用的百分位法确定四川省小时极端降水阈值. 百分位法可以给出每个站点独立的极端降水阈值, 但是为了空间可比性, 在整个研究区域内通常统一选取某个百分位数来确定阈值. 百分位数的确定因研究区域的不同而差异较大, 并且主要依靠经验分析和主观判断, 常见的百分位数选择有第95百分位[34]、97百分位[13]、97.5百分位[35]、98百分位[12]、99百分位[9]和99.9百分位[25]等.

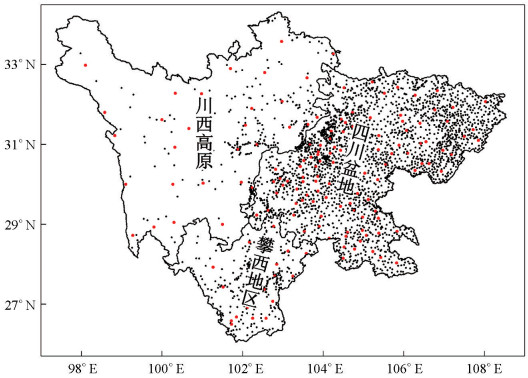
    图 2为四川省汛期不同百分位(90, 91, 92, 93, 94, 95, 96, 97, 98, 99, 99.5)小时降水的变化特征. 从图 2中可以看到, 从第90百分位到第98百分位, 无论是平均小时降水量还是最大和最小降水量均呈近似线性缓慢增加, 而从第98百分位到第99百分位则出现跳跃式增加, 平均(15.4 mm)、最大(28.2 mm)和最小(4.9 mm)的小时降水量分别增加了4.3, 10.2, 1.0 mm, 即四川省汛期第99百分位的小时降水量表现出了转折性特征, 所以本研究选择第99百分位确定四川省小时极端降水阈值. 本研究采用最小二乘法计算线性趋势, 并进行了显著性水平检验[31].

2.   结果与分析
  • 图 3为四川省小时极端降水阈值空间分布图, 可以看出, 阈值大小随着地形变化出现了明显的空间差异, 总体上海拔较低的四川盆地阈值最大, 攀西地区次之, 海拔最高的川西高原阈值最小. 四川盆地除盆周山区小时极端降水阈值在10 mm左右, 其余大部均超过15 mm, 并出现两条超20 mm的大值带;川西高原整体的阈值比较均匀, 为5~10mm;攀西地区西南部的小时极端降水阈值为15~25 mm, 其余大部为10 mm左右.

  • 首先根据阈值识别出各气象站点2012-2021年汛期所有的小时极端降水并累计得到极端降水量, 然后计算极端降水量与汛期降水总量的比值, 从而得到极端降水贡献率, 贡献率越大说明降水的极端性越强, 其带来的潜在风险可能越大, 反之亦然. 四川省汛期小时极端降水贡献率空间差异较大: 四川盆地北部和西南部为5%~15%, 盆地其余大部为15%~20%, 部分站点超过20%;川西高原大部地区极端降水贡献率为5%~10%, 北部局地在5%以下;攀西地区大部为5%~15%, 中部局地超过15%(图 4). 除盆地北部和西南部、攀西地区的西昌市外, 其余大部地区呈现汛期降水量多(少)则极端降水贡献率大(小)的特点.

  • 为了分析小时极端降水在24 h内的分配情况, 分别统计四川盆地、川西高原和攀西地区各时次出现的小时极端降水频次, 然后计算其与总频次的比值, 得到不同时次的小时极端降水频次百分比, 占比越大, 表明相应时次出现小时极端降水的概率越大, 反之则概率越小. 从图 5中可以看到, 四川省不同区域的小时极端降水频次百分比日变化曲线都呈“单峰型”, 但峰值时段有所不同, 其中川西高原的峰值时段出现最早(21: 00-02: 00, 北京时间, 下同), 攀西地区的峰值时段略向后推迟(22: 00-04: 00), 四川盆地的峰值时段出现最晚(00: 00-07: 00).

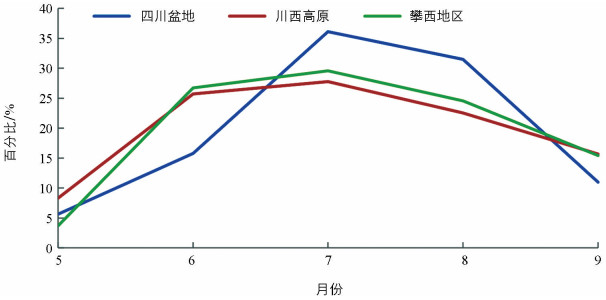
  • 为了分析小时极端降水在汛期各月的分配情况, 分别统计四川盆地、川西高原和攀西地区各月出现小时极端降水的频次, 然后计算其与总频次的比值, 得到不同月份的小时极端降水频次百分比. 图 6显示了四川省不同地区5-9月小时极端降水频次百分比的月变化, 可以看到各地区的小时极端降水都是在7月份发生概率最大, 5月份发生概率最小, 但是不同区域又有所差异, 其中四川盆地汛期接近70%的小时极端降水出现在7-8月, 而川西高原和攀西地区6-8月的小时极端降水出现概率相差不大, 均为20%~30%, 而且6月比8月更容易出现小时极端降水.

  • 小时极端降水往往是在一次连续的降水过程中出现的, 为了分析其变化特征, 首先确定小时极端降水过程的定义: 出现连续降水事件(逐小时降水量≥0.1 mm/h), 并且其中至少有1个时次的降水量超过小时极端降水阈值, 降水过程的第一个时刻为开始时间, 最后一个时刻为结束时间, 开始时间与结束时间之间的小时数为持续时间, 最大小时降水量出现的时刻为峰值时间. 分区域统计开始时间分别为00: 00-23: 00, 持续时间分别为1~24 h(持续降水超过24 h的过程极少, 这里忽略不计)的降水过程频次, 并计算其与总频次的比值, 得到不同“开始时间+持续时间”组合的小时极端降水过程占比. 采用同样的方法以峰值时间代替开始时间, 计算相应“峰值时间+持续时间”组合的小时极端降水过程占比, 结果如图 7所示.

    四川盆地小时极端降水过程主要分为两类, 一是下午(15: 00-20: 00)开始的2 h短时极端降水过程, 峰值集中出现时间与开始时间基本重合;二是后半夜开始的3~9 h持续极端降水过程, 峰值集中出现时段(22: 00-07: 00)比开始时间集中出现时段(21: 00-05: 00)平均晚1~2 h(图 7a).

    川西高原极端降水过程开始时间早晚与持续时间长短的关系不如四川盆地和攀西地区明显, 傍晚(16: 00-20: 00)开始的主要为持续1~5 h的极端降水过程, 其中持续1 h的短时强降水过程较四川盆地和攀西地区明显偏多. 凌晨前后(21: 00-04: 00)开始的极端降水过程往往可以持续3~9 h(图 7b).

    攀西地区极端降水过程与四川盆地相似, 其中傍晚至前半夜(17: 00-00: 00)开始的短时极端降水过程持续时间更长(2~4 h), 峰值集中出现时段比开始时间略晚. 后半夜开始的持续极端降水过程持续时间也更长(3~11 h), 攀西地区整体表现出的开始时间越晚持续时间越长的特征更加明显(图 7c).

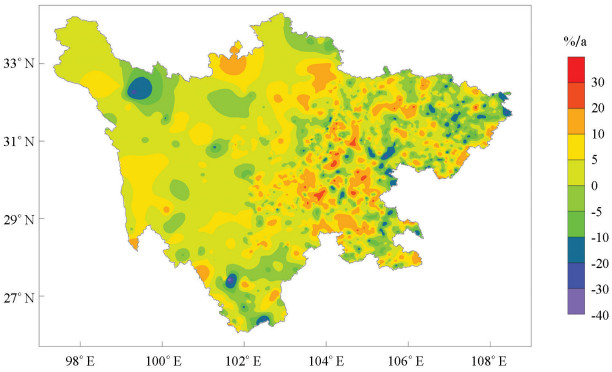
  • 表 1显示了四川省不同区域汛期小时极端降水贡献率的变化趋势, 可以发现不同区域平均的小时极端降水贡献率均呈增加趋势, 其中四川盆地的增加趋势最大(每年增加0.33%), 但是结果无统计学意义, 从空间分布(图 8)上可知, 虽然四川盆地大部呈增加趋势, 局地每年增加超过2%, 但是部分地区减少趋势也比较明显, 尤其是在四川盆地东部和中部的一些地方平均每年减少1%以上. 川西高原平均每年极端降水贡献率增加0.31%, 并且在α=0.05水平有统计学意义, 从图 8可知, 川西高原北部局地增加速率超过1%. 攀西地区平均小时极端降水贡献率每年增加0.23%, 并且在α=0.01水平有统计学意义, 但是攀西地区中部和南部仍然有部分地区呈减少趋势.

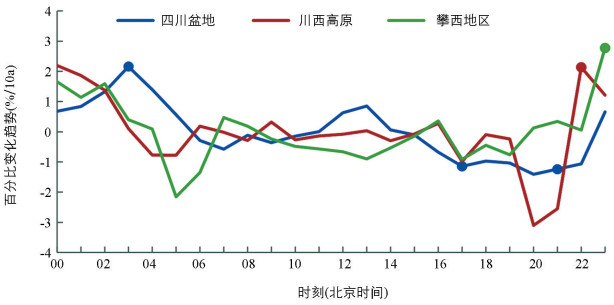
  • 参考2.2.1中的方法, 逐年统计, 分别得到不同区域不同时次的小时极端降水百分比逐年序列, 然后分析其变化趋势. 从图 9中可以看到, 四川盆地23: 00-05: 00和11: 00-14: 00时段极端降水百分比呈增加趋势, 其中03: 00在α=0.05水平有统计学意义, 其他时次为减少趋势, 17: 00和21: 00显著减少. 川西高原22: 00-03: 00极端降水百分比呈增加趋势, 其中22: 00显著增加, 其他大部分时次呈不显著的减少趋势. 攀西地区20: 00-04: 00呈增加趋势, 其中23: 00显著增加, 其他大部分时次呈不显著的减少趋势.

3.   结论与讨论
  • 本研究分析发现, 用第99百分位确定四川省小时极端降水阈值最合理, 汛期平均小时极端降水量四川盆地大于攀西地区, 攀西地区大于川西高原. 汛期小时极端降水贡献率空间差异较大, 其中四川盆地大部为5%~20%, 川西高原大部为5%~10%, 攀西地区大部为5%~15%. 各地区的小时极端降水都是在7月份发生概率最大, 5月份发生概率最小, 小时极端降水百分比日变化曲线都呈“单峰型”, 但峰值时段有所不同, 其中川西高原的峰值时段出现得最早, 攀西地区的峰值时段略向后推迟, 四川盆地的峰值时段出现最晚.

    四川盆地极端降水过程主要分为两类, 分别是下午开始的2 h短时极端降水过程和后半夜开始的3~8 h持续极端降水过程. 攀西地区极端降水过程与四川盆地相似, 并且都表现出开始时间越晚持续时间越长的特征. 川西高原傍晚开始的主要为持续1~5 h的极端降水过程, 凌晨前后开始的极端降水过程往往可以持续3~9 h. 2012-2021年四川盆地小时极端降水贡献率平均每年增加0.33%, 川西高原极端降水贡献率平均每年增加0.31%, 攀西地区平均每年增加0.23%. 全省大部分地区夜间出现小时极端降水的概率在增加.

    分析表明, 四川省小时极端降水强弱与海拔总体成反比, 川西高原和攀西地区的地形地质条件更加复杂, 虽然小时极端降水比四川盆地弱, 但是相对更容易诱发山洪、泥石流等次生灾害, 所以结合下垫面资料开展基于小时极端降水的地质灾害风险研究将有助于提升气象防灾减灾的精准、精细服务能力. 另外四川盆地小时极端降水量最大, 其中成都以及成渝双城经济圈等超大型城市群发展迅速, 极端降水往往会引发城市内涝, 所以利用城市高密度小时极端降水数据, 并结合城市排水管网资料可以建立快速预警系统, 可有效避免类似河南郑州“7.20”特大城市内涝的发生. 研究还发现四川省不同区域小时极端降水日变化有明显差异, 虽然都存在共同的夜雨特征, 但是小时极端降水过程持续时间和峰值出现时间都有所不同, 这究竟是相同天气系统因不同下垫面的不同表现引起的, 还是由不同的天气系统导致的? 这些问题还值得进一步深入研究, 进而增加对四川省复杂地形下小时极端降水形成机理的科学认知.

Figure (9)  Table (1) Reference (35)

Catalog

    /

    DownLoad:  Full-Size Img  PowerPoint
    Return
    Return