Message Board

Dear readers, authors and reviewers,you can add a message on this page. We will reply to you as soon as possible!

2020 Volume 42 Issue 1
Article Contents

Wan-hong LI, Guang-zhou FAN. Relationship Between the Frequency of Tibetan Plateau Vortex Generation in Midsummer and the Background Field of Atmospheric Circulation in Early Summer[J]. Journal of Southwest University Natural Science Edition, 2020, 42(1): 103-111. doi: 10.13718/j.cnki.xdzk.2020.01.015
Citation: Wan-hong LI, Guang-zhou FAN. Relationship Between the Frequency of Tibetan Plateau Vortex Generation in Midsummer and the Background Field of Atmospheric Circulation in Early Summer[J]. Journal of Southwest University Natural Science Edition, 2020, 42(1): 103-111. doi: 10.13718/j.cnki.xdzk.2020.01.015

Relationship Between the Frequency of Tibetan Plateau Vortex Generation in Midsummer and the Background Field of Atmospheric Circulation in Early Summer

More Information
  • Received Date: 17/09/2018
    Available Online: 20/01/2020
  • MSC: P434

  • Using the Tibetan Plateau Vortex (TPV) statistical data set obtained with the objective recognition method based on ERA-interim reanalysis data, selecting the high- and low-frequency years of the plateau vortex from 1986 to 2015, and using this reanalysis data and the National Oceanic and Atmospheric Administration OLR (outgoing long-wave radiation) data, the authors of this paper study the relationship between the plateau vortex frequency generated in July and the atmospheric circulation in June with correlation analysis and composite analysis. The main results are summarized in the following points:(1) In July, the generating sources of the TPV appear mainly in the 28°-36°N latitude zone. The number of plateau vortices generated in the area west to 90°E accounts for 74.68% of the total. (2) During high-frequency years of TPV, the relative humidity of the low-level is high, especially in the areas of Shenzha (30°-34°N, 84°-90°E) and Zuogong (about 29°N, 97°E). The atmospheric heat source is high in the vertical direction in the area west to 90°E. The convection activity is high in the plateau south to 32°N. During low-frequency years of TPV, the relative humidity of the low-level is low in the plateau south to 32°N in June. The atmospheric heat source is low in the vertical direction of the west of 90°E. The convection activity is low in the plateau south to 32°N. (3) During high-frequency years of TPV, the low-level in the main generation range of the plateau vortex is controlled by the positive relative vorticity, and the relative vorticity is too high. It promotes updrafts over the plateau, which are favorable for low-level convergence and high-level divergence. The intensity is high, but there is a certain difference between the area west to 90°E and the area east to 90°E. In Gaize, the vertical shear of horizontal wind is less severe and weaker than in low-frequency years. During low-frequency years of TPV, the low-level in the main generation range of the plateau vortex is controlled by the positive relative vorticity, and the relative vorticity is low. It promotes updrafts over the plateau, which is favorable for low-level convergence and high-level divergence. The intensity is low.
  • 加载中
  • [1] 叶笃正, 高由禧.青藏高原气象学[M].北京:科学出版社, 1979.

    Google Scholar

    [2] 王伏村, 付双喜, 张德玉, 等.一次引发河西走廊大暴雨的高原低涡的机制分析[J].气象, 2014, 40(4):412-423.

    Google Scholar

    [3] 黄楚惠, 李国平, 牛金龙, 等.一次高原低涡东移引发四川盆地强降水的湿螺旋度分析[J].高原气象, 2011, 30(6):1427-1434.

    Google Scholar

    [4] 郁淑华, 高文良.高原低涡移出高原的观测事实分析[J].气象学报, 2006, 64(3):392-399. doi: 10.3321/j.issn:0577-6619.2006.03.014

    CrossRef Google Scholar

    [5] 钱正安, 单扶民, 吕君宁, 等. 1979年夏季青藏高原低涡的统计分析及低涡产生的气候因子探讨[C]//《青藏高原气象科学实验文集》编辑组.青藏高原气象科学实验文集(二).北京: 科学出版社, 1984: 182-194.

    Google Scholar

    [6] 陶诗言, 罗四维, 张鸿材. 1979年5-8月青藏高原气象科学实验及其观测系统[J].气象, 1984, 10(7):2-5.

    Google Scholar

    [7] 青藏高原低值系统协作组.盛夏青藏高原低涡发生发展的初步研究[J].中国科学, 1978, 21(3):341-350.

    Google Scholar

    [8] 青藏高原气象科学研究拉萨会战组.夏半年青藏高原500毫巴低涡切变线的研究[M].北京:科学出版社, 1981:1-57.

    Google Scholar

    [9] 李国平, 赵福虎, 黄楚惠, 等.基于NCEP资料的近30年夏季青藏高原低涡的气候特征[J].大气科学, 2014, 38(4):756-769.

    Google Scholar

    [10] 杨伟愚, 杨大升, Yang Weiyu Yang Dasheng.正压大气中青藏高原地形影响的数值试验[J].高原气象, 1987, 6(2):117-129.

    Google Scholar

    [11] 陈伯民, 钱正安, 张立盛.夏季青藏高原低涡形成和发展的数值模拟[J].大气科学, 1996, 20(4):491-502. doi: 10.3878/j.issn.1006-9895.1996.04.14

    CrossRef Google Scholar

    [12] 罗四维, 杨洋, 吕世华.一次青藏高原夏季低涡的诊断分析研究[J].高原气象, 1991, 10(1):1-12.

    Google Scholar

    [13] 李国平, 卢会国, 黄楚惠, 等.青藏高原夏季地面热源的气候特征及其对高原低涡生成的影响[J].大气科学, 2016, 40(1):131-141.

    Google Scholar

    [14] DELL'OSSO L, CHEN S J. Numerical Experiments on the Genesis of Vortices over the Qinghai-Tibet Plateau[J]. Tellus A:Dynamic Meteorology and Oceanography, 1986, 38(3):236-250. doi: 10.3402/tellusa.v38i3.11715

    CrossRef Google Scholar

    [15] SHEN R, REITER E R, BRESCH J F. Numerical Simulation of the Development of Vortices over the Qinghai-Xizang (Tibet) Plateau[J]. Meteorology and Atmospheric Physics, 1986, 35(1-2):70-95. doi: 10.1007/BF01029526

    CrossRef Google Scholar

    [16] WANG B. The Development Mechanism for Tibetan Plateau Warm Vortices[J]. Journal of the Atmospheric Sciences, 1987, 44(20):2978-2994. doi: 10.1175/1520-0469(1987)044<2978:TDMFTP>2.0.CO;2

    CrossRef Google Scholar

    [17] WANG B, ORLANSKI I. Study of a Heavy Rain Vortex Formed over the Eastern Flank of the Tibetan Plateau[J]. Monthly Weather Review, 1987, 115(7):1370-1393. doi: 10.1175/1520-0493(1987)115<1370:SOAHRV>2.0.CO;2

    CrossRef Google Scholar

    [18] 李国平, 赵邦杰, 杨锦青.地面感热对青藏高原低涡流场结构及发展的作用[J].大气科学, 2002, 26(4):519-525. doi: 10.3878/j.issn.1006-9895.2002.04.09

    CrossRef Google Scholar

    [19] FENG X Y, LIU C H, RASMUSSEN R, et al. A 10-yr Climatology of Tibetan Plateau Vortices with NCEP Climate Forecast System Reanalysis[J]. Journal of Applied Meteorology and Climatology, 2014, 53(1):34-46. doi: 10.1175/JAMC-D-13-014.1

    CrossRef Google Scholar

    [20] 王鑫, 李跃清, 郁淑华, 等.青藏高原低涡活动的统计研究[J].高原气象, 2009, 28(1):64-71.

    Google Scholar

    [21] 林志强. 1979-2013年ERA-Interim资料的青藏高原低涡活动特征分析[J].气象学报, 2015, 73(5):925-939.

    Google Scholar

    [22] 张博, 李国平.基于CFSR资料的青藏高原低涡客观识别技术及应用[J].兰州大学学报(自然科学版), 2017, 53(1):106-111, 118.

    Google Scholar

    [23] WERNLI H, SCHWIERZ C. Surface Cyclones in the ERA-40 Dataset (1958-2001). Part Ⅰ:Novel Identification Method and Global Climatology[J]. Journal of the Atmospheric Sciences, 2006, 63(10):2486-2507. doi: 10.1175/JAS3766.1

    CrossRef Google Scholar

    [24] 林志强, 周振波, 假拉.高原低涡客观识别方法及其初步应用[J].高原气象, 2013, 32(6):1580-1588.

    Google Scholar

    [25] LUO H B, YANAI M. The Large-Scale Circulation and Heat Sources over the Tibetan Plateau and Surrounding Areas during the Early Summer of 1979. Part Ⅱ:Heat and Moisture Budgets[J]. Monthly Weather Review, 1984, 112(5):966-989. doi: 10.1175/1520-0493(1984)112<0966:TLSCAH>2.0.CO;2

    CrossRef Google Scholar

  • 加载中
通讯作者: 陈斌, bchen63@163.com
  • 1. 

    沈阳化工大学材料科学与工程学院 沈阳 110142

  1. 本站搜索
  2. 百度学术搜索
  3. 万方数据库搜索
  4. CNKI搜索

Figures(8)

Article Metrics

Article views(1270) PDF downloads(201) Cited by(0)

Access History

Other Articles By Authors

Relationship Between the Frequency of Tibetan Plateau Vortex Generation in Midsummer and the Background Field of Atmospheric Circulation in Early Summer

Abstract: Using the Tibetan Plateau Vortex (TPV) statistical data set obtained with the objective recognition method based on ERA-interim reanalysis data, selecting the high- and low-frequency years of the plateau vortex from 1986 to 2015, and using this reanalysis data and the National Oceanic and Atmospheric Administration OLR (outgoing long-wave radiation) data, the authors of this paper study the relationship between the plateau vortex frequency generated in July and the atmospheric circulation in June with correlation analysis and composite analysis. The main results are summarized in the following points:(1) In July, the generating sources of the TPV appear mainly in the 28°-36°N latitude zone. The number of plateau vortices generated in the area west to 90°E accounts for 74.68% of the total. (2) During high-frequency years of TPV, the relative humidity of the low-level is high, especially in the areas of Shenzha (30°-34°N, 84°-90°E) and Zuogong (about 29°N, 97°E). The atmospheric heat source is high in the vertical direction in the area west to 90°E. The convection activity is high in the plateau south to 32°N. During low-frequency years of TPV, the relative humidity of the low-level is low in the plateau south to 32°N in June. The atmospheric heat source is low in the vertical direction of the west of 90°E. The convection activity is low in the plateau south to 32°N. (3) During high-frequency years of TPV, the low-level in the main generation range of the plateau vortex is controlled by the positive relative vorticity, and the relative vorticity is too high. It promotes updrafts over the plateau, which are favorable for low-level convergence and high-level divergence. The intensity is high, but there is a certain difference between the area west to 90°E and the area east to 90°E. In Gaize, the vertical shear of horizontal wind is less severe and weaker than in low-frequency years. During low-frequency years of TPV, the low-level in the main generation range of the plateau vortex is controlled by the positive relative vorticity, and the relative vorticity is low. It promotes updrafts over the plateau, which is favorable for low-level convergence and high-level divergence. The intensity is low.

  • 青藏高原作为中国最大、世界海拔最高、地形最复杂的高原,对于中国、亚洲,甚至是全世界的气候都有着极大的影响.青藏高原独特的地形会对大气环流产生机械强迫作用,同时其平均4 000 m的高度产生的热力作用也是不可忽视的.高原涡是产生于500 hPa上的一个特殊的天气系统.叶笃正等[1]指出,高原低涡的水平尺度约500 km,垂直厚度约2~3 km,通常出现在夏季,是重要的降水天气系统.在一定环流背景下,高原涡可东移发展移动出高原,给青藏高原周边地区以及我国东部的长江、黄淮流域等带来暴雨、大暴雨等灾害性天气[2-4].

    关于影响高原涡生成的因素,钱正安等[5]提出了6个,分别是相对涡度、正压不稳定度、风的垂直切变、地面感热、层结稳定度和相对湿度等.陶诗言等[6]发现近地层气层的不稳定度大、500~300 hPa高度层的正压不稳定性大、风的垂直切变小、低层的相对涡度大、地气温差大及相对湿度大等这6个气候因子求得的高原涡源地分布与实际情形较一致.青藏高原低值系统协作组[7]认为在西风扰动和高原加热的共同作用下高原低涡将发展,副热带长波调整为西槽东脊型是青藏高原低涡发展的前提.拉萨会战组[8]认为低涡的生成与西风带环流、副热带环流、500 hPa南支槽、印度—孟加拉湾低压和100 hPa南亚高压有关.李国平等[9]认为伊朗高原上空的气旋、青藏高原低槽和高原南侧反气旋的配置对高原低涡的生成具有重要作用.杨伟愚等[10]、陈伯民等[11]通过数值试验认为高原地形的动力作用对高原涡这种局地性低压涡旋形成有十分重要的作用.

    关于热力作用对高原低涡的影响,罗四维等[12]、李国平等[13]认为地面感热相比潜热对低涡的生成起了决定性的作用. Dell'osso等[14]、Shen等[15]、Wang等[16-17]认为地表潜热对低涡的发展有重要作用,且感热会限制高原低涡发展.李国平等[18]借鉴热带气旋类低涡(Tropical Cyelone-Like Vortiees,简称TCLV)的分析方法,认为当地面感热加热中心与低涡中心配置一致时,有利于低涡的发展,并且高原低涡系统的不稳定增长率与纬度成反比,即纬度越低,越有利于低涡发展.

    目前有关于高原涡生成的因素影响的个例研究较多,也得到了很多研究者们的认同,而对于长时间序列的高原涡特征研究较少,并且也多是关于对高原涡东移发展过程的研究.本研究通过分析初夏(本文指6月)大气环流背景与盛夏(本文指7月)高原涡生成频数的关系,以期能够找出其中的物理机制.

1.   资料与方法
  • 对于高原涡的统计,通常有人工识别法[19-20]与客观识别法[21-22].这两种方法得出的结果也有差异,甚至差异较大.其中的差异除了方法所致,资料的不同也有一定影响.本研究所用的高原涡数据集是来自于林志强[21],其参考了Wernli等[23]提出的气旋识别方法和林志强等[24]的高原涡识别标准并利用ERA-interim空间分辨率为1°×1°的再分析资料得出的一套高原涡统计数据集.

    采用的再分析资料,包含相对湿度、高度场、温度场、风场、散度、垂直速度等均为ERA-interim月平均资料,空间分辨率为1°×1°.

    大气热源的计算采用了倒算法[25],即:

    式中:θ为位温;V为水平风矢量;ωp坐标垂直速度;k=R/cpRcp分别是气体常数和干空气的等压比热,p0=1 000 hPa.

    分析方法主要为相关分析与合成分析.统计分析的青藏高原区域范围界定为(28°-40°N,75°-100°E).

2.   结果分析
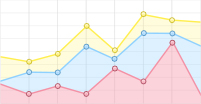
  • 图 1给出了1986-2015年7月的高原涡生成地分布.可以看出,高原涡主要生成在75°-100°E,28°-36°N之间.其中90°E以西地区生成的高原涡数量占到了整个7月的74.68%,是高原涡生成集中区域. 90°E以东有高原涡生成,但数量相比西部要少很多. 36°N以北很少有高原涡生成.

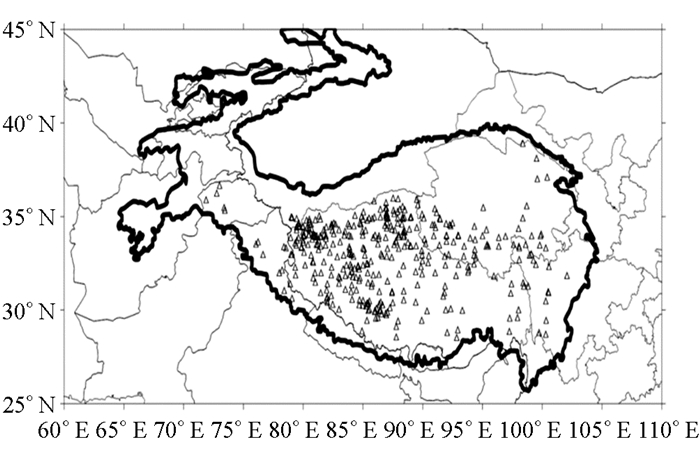
    图 2为7月高原低涡生成个数标准化距平的年际变化.平均每年7月高原涡生成个数约13.2个.最多时每年可生成20个,发生在1999年与2011年,最少时每年只生成5个,在2015年.根据30年的高原涡生成个数标准化序列,将高于一个标准差定义为高原涡多发年,小于一个标准差定义为高原涡少发年.多发年有7个,分别是:1998,1999,2000,2004,2008,2011和2012年.少发年有5个,分别是:1989,1994,2006,2010和2015年.

  • 在600 hPa相对湿度相关系数图中(图 3a),青藏高原35°N以南范围皆为正相关,措勤(31°N,85°E)附近为显著正相关区域,即初夏相对湿度越大,高原涡7月生成个数越多.多发年(图 3b)初夏除了高原西北部,大部分高原地区相对湿度明显高于多年平均值,正距平大值中心位于措勤,最大距平值为6%;少发年(图 3c),由西南—东北,相对湿度距平值逐渐增大.措勤地区的相对湿度低于多年平均值,最大相差4%,正好与多发年的距平正值大值区相对应.

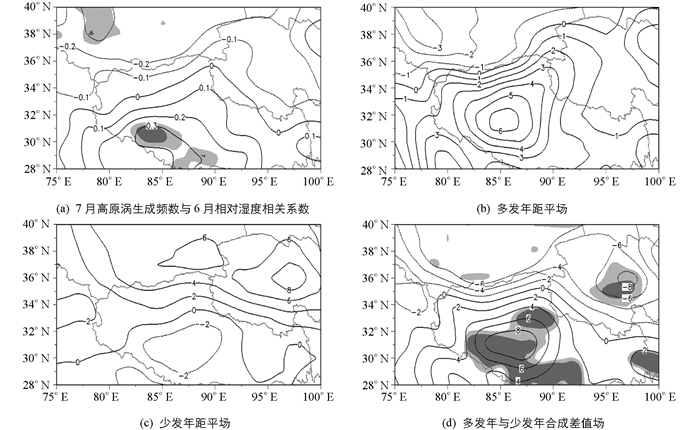
    在600 hPa相对湿度合成差值图(图 3d)中,可见差异性有统计学意义,正距平差值区域与相关系数图分布基本一致,高原涡多发年在高原涡主要生成范围内的相对湿度是偏大的,整体呈北干南湿.改则—申扎(30°-34°N,84°-90°E)与左贡(约29°N,97°E)两处各有一个显著区域,改则—申扎一带出现的正距平差值最大值达10%;高原北部负距平区域内,基本无高原涡生成.

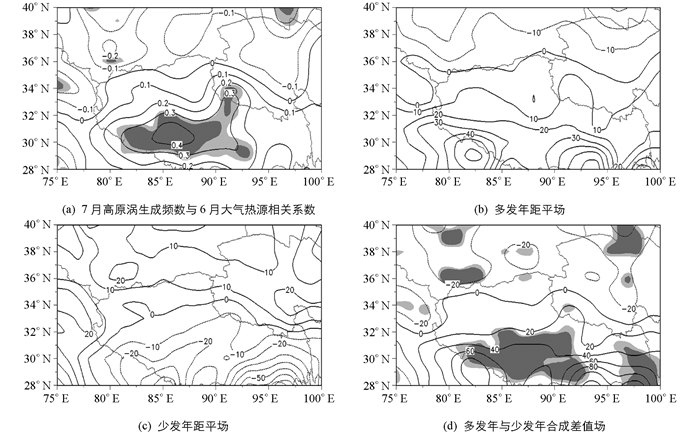
  • 高原涡生成频数与地面热源Q1相关系数图(图 4a)中,高原涡主要生成范围内为正相关,显著正相关区域在狮泉河—那曲(28°-34°N,80°-95°E)一带.高原涡多发年(图 4b),青藏高原大部分地区地面热源高于多年平均值,南部地面热源比多年平均值高10~30 w/m2.少发年(图 4c),地面热源整体呈北高南低,大致以34°N为界,北部地区地面热源高于多年平均值,南部地区地面热源低于多年平均值.多发年与少发年地面热源的合成差值的分布(图 4d)与相关系数图基本一致,高原涡多发年35°N以南地面热源偏强,同样也是在狮泉河—那曲一带以及左贡附近存在两个正距平显著区域,与上面相对湿度合成差值图中的显著区域相对应,多发年与少发年的地面热源差值在20 w/m2以上.因此整体地面热源偏强,尤其在狮泉河—那曲一带以及左贡,有利于高原低涡的生成;而整体地面热源偏弱,并且高原南北部地面热源分布差异较大时,不利于高原低涡的生成.

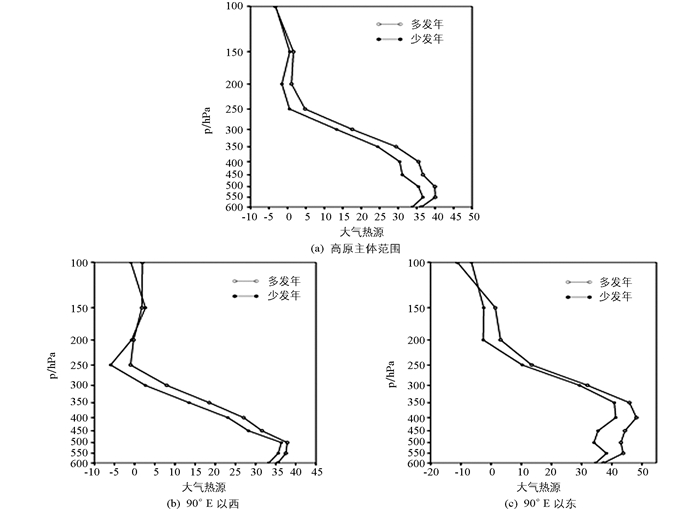
    在大气热源垂直变化图中,可看到高原整体范围内(图 5a),大气热源垂直方向上均为正值,表现为热源.高原涡多发年的大气热源强度大于少发年. 600~550 hPa大气热源随高度升高而增大,在550 hPa达到最大值,多发年为40 w/m2,少发年约为36 w/m2. 550 hPa以上,大气热源随高度升高而减小.高原90°E以西(图 5b),高原涡多发年垂直方向上均表现为热源,整体强于少发年,最大值出现在500 hPa,约为38 w/m2.少发年300 hPa以下,各层均表现为热源,最大值出现在500 hPa,为36 w/m2. 300~200 hPa大气热源为负,表现为热汇. 90°E以东(图 5c),各层大气热源强度相比西部偏强.大气热源在550 hPa达到一个大值后逐渐减小,到了500 hPa又随高度升高而增大,在400 hPa达到最大值,多发年约为49 w/m2,少发年为40 w/m2.高原涡多发年与低发年低层都表现为热源,多发年150 hPa以上为热汇,少发年200 hPa以上为热汇.

    由上述分析来看,高原涡多发年,高原改则—申扎以及左贡低层有大的相对湿度,整体大气热源表现为热源且偏强.少发年,低层相对湿度小,整体大气热源表现为热源但偏弱.

  • 从6月多发年与少发年的600 hPa相对涡度分布图上(图略)可发现在30°-36°N纬度带内均为正相对涡度,这也是高原涡主要生成范围.从高原涡频数与600 hPa相对涡度相关系数图(图 6a)中可以看出,7月高原涡生成频数与6月相对涡度在30°N附近呈正相关.多发年(图 6b),高原30°-36°N纬度带内相对涡度与多年平均值无较大差别;少发年(图 6c),狮泉河—那曲一带相对涡度明显小于多年平均值.

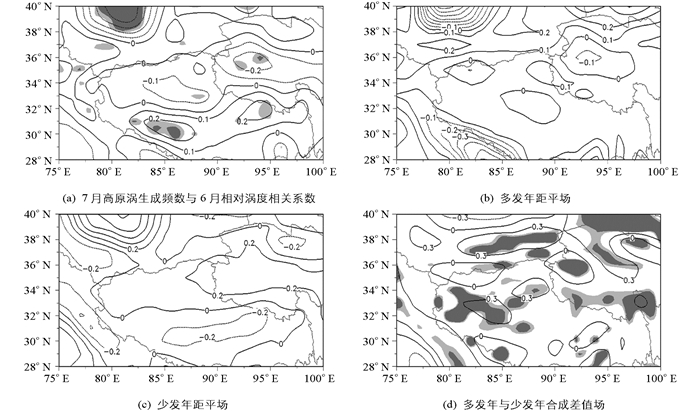
    图 6d为高原涡多发年与少发年600 hPa相对涡度的合成差值图,其差异性明显.正距平差值区域在30°-35°N之间,显著性区域在噶尔—申扎(30°-34°N,80°-90°E)一带以及西藏与青海交界处.

  • 高原主体范围内(图 7a)600~100 hPa散度垂直分布表现为低层辐合,高层辐散,500~450 hPa为无辐散层. 500 hPa以下为辐合,随着高度的升高散度减小,450 hPa以上为辐散,随着高度的升高,散度先增大后减小.辐合最大值均出现在600 hPa,多发年辐散最大值在250 hPa,超过0.2×10⁻⁵/s,少发年辐散最大值在200 hPa以上.并且多发年低层辐合高层辐散强度强于少发年. 90°E以西地区(图 7b),高原涡多发年散度值相比整体范围散度值偏小. 600~550 hPa散度随高度升高而增大,550 hPa为辐合最强的高度层. 450 hPa以上散度随高度升高先增大后减小,在350 hPa达到最大值,即辐散强度最大,超过0.15×10⁻⁵/s.高原涡少发年同样是在550 hPa达到辐合最大值,但辐散最大值出现在200 hPa以上. 250~200 hPa散度随高度升高而增大. 200 hPa以下,多发年的辐散辐合强度皆大于少发年,200 hPa以上高原涡少发年散度值大于多发年. 90°E以东地区(图 7c),高原涡多发年散度值相比整体范围散度值偏大,低层辐合稍强于少发年. 350~250 hPa辐散弱于少发年,250 hPa以上多发年辐散强于少发年,在250 hPa达到辐散最大.

  • 由高原整体范围(图 8a)垂直速度分布可以看出,从低层到高层皆为上升气流.高原低涡多发年与少发年的垂直速度随高度变化趋势基本一致,多发年的垂直速度较少发年偏大,在600~550 hPa之间垂直速度基本不变,550~450 hPa垂直速度随高度升高而增大,于450 hPa达到最大值,多发年为6×10⁻⁴ hPa/s,少发年为5.3×10-4 hPa/s. 450 hPa以上,垂直速度随高度升高逐渐减小. 90°E以西地区(图 8b),高原涡多发年垂直速度在250 hPa以下大于少发年,600~550 hPa垂直速度随高度升高而减小,550 hPa以上垂直速度随高度升高先增大后减小,在450 hPa达到最大值,多发年为4.7×10⁻⁴ hPa/s,少发年为4×10-4 hPa/s. 250 hPa以上,少发年的垂直速度大于多发年. 90°E以东地区(图 8c)垂直速度整体偏大,600~450 hPa垂直速度随高度升高而增大,均在450 hPa达到最大,多发年最大垂直速度为7.9×10⁻⁴ hPa/s,少发年最大垂直速度为7×10-4 hPa/s.

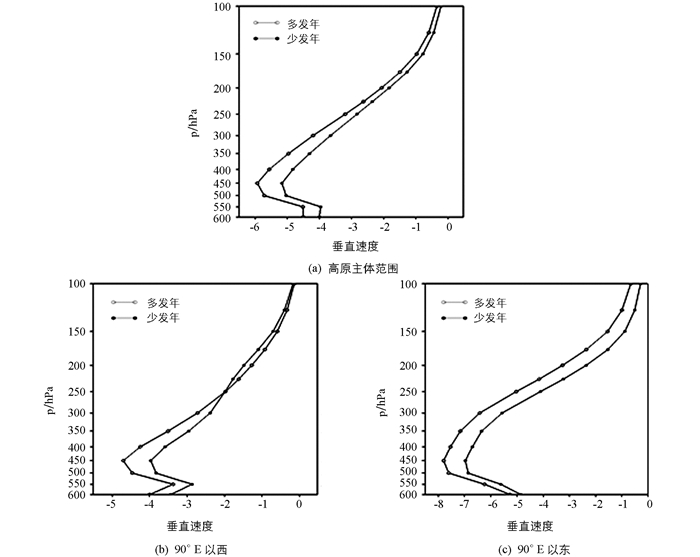
    由上述分析可知,高原涡主要生成在低层为正相对涡度控制区内,高原涡多发年,那曲地区低层正相对涡度偏强,有利于气旋性涡度生成;低层辐合高层辐散,强度偏大,有利于气旋性涡度增强;整层表现为上升气流,低层上升速度偏大,可将地面热量以及水汽输送至上层,结合低层的气旋性环流,能增强高原对流活动,从而有利于高原涡生成.

3.   结论与讨论
  • 对高原涡多(少)发年的6月大气环流做了相关分析,结果表明,影响7月高原涡生成的热力、动力背景场有明显的差异,得到了以下初步结果:

    (1) 近30年7月高原涡平均每年生成约13.2个.高原涡生成地主要集中在高原中西部,36°N以北基本无高原涡生成.

    (2) 高原低涡生成频数与低层相对湿度、整层大气热源呈显著正相关.多发年,90°E以西垂直方向上各层均表现为热源,少发年高层表现为热汇.

    (3) 高原低涡多发年,低层正相对涡度偏强,有利于气旋性涡度生成.在6月高原整层较强的大气热源有利背景下,垂直方向上低层辐合高层辐散的强度增强,造成的较强上升运动,为高层输送更多的水汽与热量,有利于高原低涡的生成.

    高原低涡是一个中尺度天气系统,一般持续时间也较短,而本研究主要使用了逐月的再分析资料研究了初夏的动力背景场以及热力背景场对盛夏高原低涡的生成影响,因此后续还需要在更小的时间尺度上进行进一步分析.

Figure (8)  Reference (25)

Catalog

    /

    DownLoad:  Full-Size Img  PowerPoint
    Return
    Return