全文HTML
-
中东欧国家由阿尔巴尼亚、波斯尼亚和黑塞哥维那(以下简称波黑)、保加利亚、克罗地亚、捷克、爱沙尼亚、匈牙利、拉脱维亚、立陶宛、黑山、波兰、罗马尼亚、塞尔维亚、斯洛伐克、斯洛文尼亚、马其顿16国组成,位于欧洲中东部,总面积134.27万平方公里,总人口约1.20亿。近年来欧元区经济增长持续低迷,对中东欧经济发展构成潜在风险。因此,习近平主席提出的“一带一路”倡议,得到了中东欧16国的积极支持和参与,各国都致力于加强与中国的经贸合作,推动其经济多元化发展。对中国而言,中东欧国家地理位置优越,是“丝绸之路经济带”西进欧洲的重要桥梁,且与中国出口产品结构互补,是中国企业走出去的理想场所。根据联合国贸易与发展组织(UNCTAD)提供的数据,2017年,中国与中东欧国家货物进出口贸易总额约680亿美元,占中国对全球贸易总额的1.66%,占中国对“一带一路”沿线国家贸易总额的5.56%。2005-2017年,中国对中东欧国家货物进出口年均增速约14.81%,明显高于中国对“一带一路”沿线国家和对全球贸易的年均增长速度。中国与中东欧国家良好的贸易合作依赖于双方的贸易竞争与互补关系,如果中国与中东欧各国出口产品结构高度相似,则表明中国与中东欧国家存在激烈的贸易竞争关系;如果中国出口产品结构与中东欧各国进口产品结构高度吻合,则说明中国与中东欧国家贸易互补关系强[1]。厘清中国与中东欧国家的贸易竞争与互补关系可以为探索中国与中东欧国家贸易投资合作的前景和重点产业提供依据。
目前,关于中国与中东欧国家的研究主要集中在以下几个方面:一是针对双边经贸合作的研究。姜琍对中国和捷克的经贸合作发展现状进行了梳理[2]。萨尔米扎·彭恰和尤利亚·莫妮卡·奥埃赫列亚-欣卡伊分析了近年来罗马尼亚与中国贸易的主要趋势,并指出罗马尼亚没有充分利用其比较优势,导致与中国之间的直接联系和贸易往来不够密切[3]。二是针对中国与中东欧国家合作机制的研究。比如,刘作奎认为中东欧可以借重中国和中东欧合作机制、中国和欧盟相关合作机制以及亚欧会议机制参与丝路建设[4]。于军梳理了中国与中东欧国家的合作机制及取得的成效,指出“一带一路”为中国与中东欧国家深化合作、完善合作机制提供了契机[5]。朱晓中对“16+1”框架合作的成果进行了梳理,提出未来要与中东欧各国细化“16+1”框架内不同层次和规模的合作[6]。三是对中国与中东欧国家关系进行研究。如鞠维伟探讨了如何运用“丝绸之路经济带”发展与中东欧国家的关系,提出“丝绸之路经济带”建设提高了中国与中东欧合作的战略关联度和依存度[7]。龙静提出,重视中东欧国家的特殊性,提升经济合作“早期收获”的示范效应,加大对次区域组织的研究和参与,以应对中国与中东欧国家关系的挑战[8]。四是针对贸易效应的研究。窦菲菲对中东欧国家与中国经贸往来中的挤出效应和转移效应的形成及其原因进行了分析[9]。尚宇红、高运胜对中国与中东欧10国出口产品竞争力及结构效应进行了研究,并运用CMSA模型进行实证分析[10]。沈子傲、韩景华测算了中国与中东欧16国分别在美国、德国、俄罗斯和世界市场上的出口相似度指数以及中东欧各国与贸易伙伴的贸易结合度指数,从产品角度上分析了中国与中东欧国家的互补性与竞争性,但并未涉及中国与16国之间整体的贸易关系分析[11]。侯敏、邓琳琳采用随机前沿引力模型测度了中国对中东欧国家的出口贸易效率和贸易潜力。截至目前,几乎没有文献对中国与中东欧16国的贸易或产业结构关系进行整体性分析[12]。
与现有文献不同的是,本文在研究方法上创新性地采用了社会网络分析法(Social Network Analysis)。根据Wasserman & Faust[13],Reyes[14]以及Cassi et al.[15]对社会网络分析方法的应用研究,本文认为,把中国与中东欧国家的贸易关系看成一个网络整体,把各国看成整体网络中的一个节点,根据各节点之间的贸易往来,可以立体展示中国与中东欧各国的贸易关系。同时,本文在内容上详细描述了中国与中东欧国家的货物贸易格局,为读者呈现一幅贸易全景图,为推动中国与中东欧国家的经贸合作升级提供理论参考。特别是在逆全球化升温、贸易保护主义日益严峻的大背景下,积极开展中国与中东欧国家的经贸合作,对于推进“一带一路”倡议的实施、推动贸易全球化进程具有重要的现实意义。
-
近年来,中东欧各国货物贸易进出口总额持续增长。根据联合国贸易与发展组织提供的数据,从整体上看,2005至2017年,中东欧国家货物出口小于进口,呈贸易逆差状态(仅2016年产生贸易顺差)。2005至2017年,中东欧16国货物出口年均增长速度达到8.08%,分别快于“一带一路”沿线国家和全球货物出口年均增速0.81和3.41个百分点;进口年均增长速度约6.70%,比“一带一路”沿线国家货物进口年均增长速度低1.38个百分点,但快于全球2.44个百分点。
从趋势上看,中东欧16国进出口贸易增长大幅波动。2005-2008年,中东欧16国货物进出口年均增速约25.36%,超过“一带一路”年均增速2.90个百分点,超过全球年均增速9.95个百分点。受全球金融危机影响,2009年,中东欧16国货物进出口出现了“大幅跳水”,进出口总额下降超过25.87%。2010年和2011年,又分别以16.18%和19.46%的增速实现恢复性增长。2012年受欧债危机影响,进出口增速跌至-4.27%。2013至2014年,全球货物贸易处于增长停滞状态,中东欧16国货物进出口贸易分别以5.19%和4.79%的增速缓慢增长,但明显快于“一带一路”和全球增速。2015至2016年,世界经济持续低迷,全球货物进出口与“一带一路”沿线国家进出口均呈负增长,其中,2015年跌幅超过10%。然而,中东欧16国所受影响相对较小,2015年货物进出口仅下跌4.90%;2016年又以2.70%的增速缓慢增长。2017年,全球贸易回暖,中东欧16国货物贸易增长12.17%,其中出口增长10.97%,进口增长13.37%。
-
中国与中东欧各国的贸易活动日渐频繁。根据联合国贸易与发展组织提供的数据统计,2005至2017年,中国对中东欧国家进出口一直处于贸易顺差状态,出口总额成倍高于进口,年均货物出口超过进口的300%。2005年,中国对中东欧16国货物出口总额约107亿美元,分别占中国对“一带一路”沿线国家和全球出口总额的8.17%和1.42%;2017年,中国对中东欧16国货物出口总额约495亿美元,分别占中国对“一带一路”沿线国家和全球出口总额的7.79%和2.19%。2005至2017年,中国对中东欧16国货物出口年均增长速度达到15.53%,快于中国对全球货物出口年均增速的4.03个百分点。2005年,中国向中东欧16国货物进口总额约21亿美元,分别占中国向“一带一路”沿线国家和全球进口总额的1.53%和0.33%;2017年,中国向中东欧16国货物进口总额达到185亿美元,分别占中国向“一带一路”沿线国家和全球进口总额的3.15%和1.00%。2005至2017年,中国向中东欧16国货物进口的年均增长速度约19.59%,分别快于中国向“一带一路”沿线国家和全球进口年均增速6.97和10.65个百分点。从整体趋势上看,中国对中东欧16国进出口贸易增速大幅波动(见图 1)。
2005至2017年,中国对中东欧16国货物进出口体现出高度集中化趋势:(1)进出口总额排名前五的国家约占中国对中东欧16国进出口总额的80%。其中,中国对波兰、捷克、匈牙利、罗马尼亚四国的进出口排名最稳定,占中国对中东欧16国进出口总额的三分之二以上(但中国对匈牙利、罗马尼亚的出口份额不断下跌)。(2)中国对波兰的出口排名稳居第一,且出口总额不断增加。2005年,中国对波兰出口约26亿美元,占中国出口至中东欧国家总额的24.05%;2017年出口总额约179亿美元,占比增至36.12%。波兰在中国对中东欧国家出口格局中占据越来越重要的位置。进口方面,尽管中国向波兰进口总额不断增加,但排名和占比却明显下跌。(3)中国对斯洛伐克、斯洛文尼亚、阿尔巴尼亚等国的出口潜力不断增加,其出口总额和占比不断攀升。捷克、斯洛伐克在中国对16国进口格局中占据越来越重要的地位。尤其是斯洛伐克,2005年中国向斯洛伐克进口不足2亿美元,占中国向16国进口总额的8.47%;2017年,进口总额约26亿美元,比例提升至13.98%。
从进出口产品结构上看,中国对中东欧16国进出口产品也高度集中。(1)进出口排名前十的产品占中国向中东欧国家进出口产品总额的80%左右。(2)中国对中东欧出口排名前十的产品为:电子电气设备,机械设备及零附件,精密仪器及设备,家具、寝具、灯具,车辆及零件(轨道除外),玩具、游戏、运动用品,非针织服装,针织服装,塑料及制品,钢铁制品。与2005年相比,2017年出口排名前十的产品种类未发生明显变化,但出口总额成倍增长。以电子电气设备为例,2017年,中国对中东欧16国出口电子电气设备类产品约140亿美元,占该产品中国出口全球总额的1.17%。也就是说,中国对全球出口的电子电气设备总额中,有1.17%是出口至中东欧国家的(2005年这一比例仅0.92%)。(3)中国向中东欧进口的产品主要集中为:车辆及零件(轨道除外),电子电气设备,机械设备及零附件,铜及其制品,精密仪器及设备,木及木制品,家具、寝具、灯具,矿砂、矿渣及矿灰,橡胶及制品,塑料及制品。2017年,中国进口的非轨道车辆及零件总额中,有2.72%是向中东欧16国进口的。
一. 中东欧国家的贸易特征
二. 中国与中东欧国家的货物贸易格局
-
本文分别用进出口值、贸易竞争指数(CS)和贸易互补指数(TCI)来代表成对国家间的进出口关系、贸易竞争关系和贸易互补关系。根据罗伯特·J·凯伯[16]以及李敬、陈旎等[1],可将贸易竞争指数(CS)和贸易互补指数(TCI)作如下定义:
ain和ajn分别代表i国和j国在产业n上的比较优势。两国比较优势越接近,CS值越大,贸易竞争越激烈。
mni-xnj表示i国n产业的进口与j国n产业的出口接近度,其绝对值越小,说明两国的进出口结构越互补,TCI值也越大。
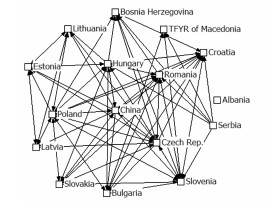
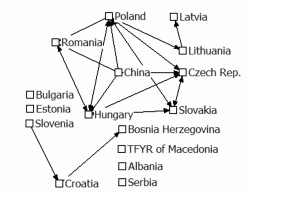
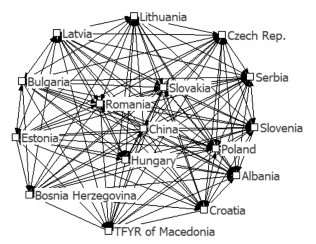
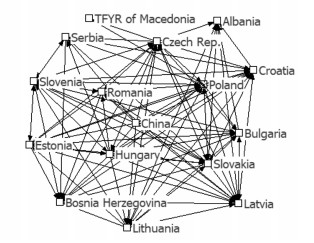
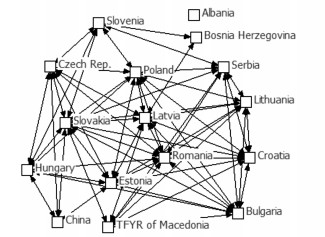
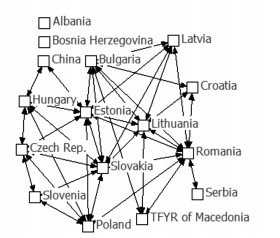
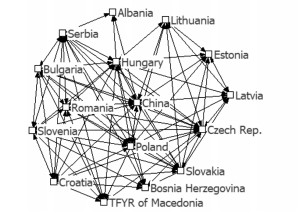
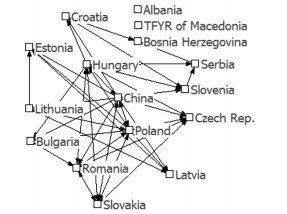
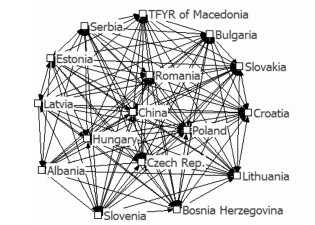
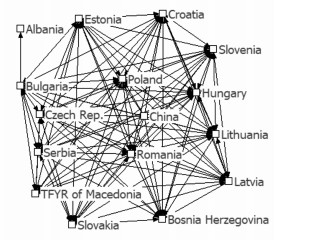
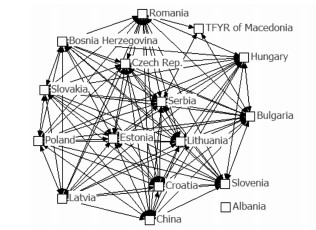
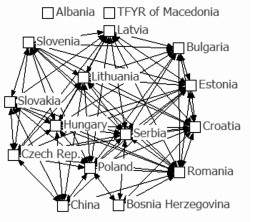
本文根据联合国贸发会议提供的数据,计算了中国和中东欧各国两两国家之间的贸易竞争与互补关系指数,并根据其结果,构建了2005年和2017年两个时间维度的网络来进行动态比较。同时,选择了中国及中东欧16国中两年都有分类数据的15个国家来构建网络为了数据的一致性,未选择黑山加入网络①。本文将贸易显著值②。分别设为:出口≥1亿美元、出口≥10亿美元、TCI≥0.2、TCI≥0.3、CS≥0.2、CS≥0.3,并由此构建了中国与中东欧国家的贸易关系网络图(见图 2至图 13)。
① 为了数据的一致性, 未选择黑山加入网络。
② 两国贸易关系指数达到显著值,即表明两国的贸易关系为显著贸易关系。
-
各贸易网络中实际拥有的连线数与理论上整个网络最大可能拥有的连线数之比即为网络密度[17]。一个贸易网络的密度越大,说明该网络中各国之间的贸易关系越紧密,也即网络中显著贸易关系数越多。根据定义,图 2-13的网络密度计算见表 1。
2005年出口≥1亿美元和≥10亿美元的网络密度分别为0.392和0.096,而2017年分别为0.600和0.233,增长了53.19%和143.48%,说明2017年中国和中东欧国家大于1亿美元和10亿美元以上的出口关系占比达到60.00%和23.30%,显著出口关系数明显增加。2005年TCI≥0.2和TCI≥0.3的互补关系网络密度分别为0.817和0.504,2017年分别增长至0.863和0.704,网络密度分别增长了5.67%和39.67%,说明中国和中东欧国家贸易互补性明显增强。2017年CS≥0.2和CS≥0.3的竞争关系网络密度分别为0.775和0.600,较2005年分别增长了47.62%和94.59%,说明中国与中东欧国家之间的贸易竞争也在加剧。但总体上互补大于竞争,因此中国与中东欧国家之间具有较大的经贸合作空间。
-
本文用中心性(Centrality)指标来研究中国与中东欧各国在贸易关系网络中的地位和作用;而相对度数中心度(Degree Centrality)De和相对度数中心势指数NC(Network Centralization)则分别用来分析各贸易网络的中心性以及各网络的中性化趋势与差异。根据刘军[18],构建如下公式。
n代表网络中与各国实际相连的国家数,N表示网络中与各国在理论上最大可能相连的国家数。
N为各贸易关系网络中的国家总数,Max(De)代表网络中各国De的最大值。
各贸易关系网络的中心性结果分析如下(见表 2)。第一,中国与中东欧国家的所有贸易关系都更为紧密。与2005年相比,2017年出口≥1亿美元、出口≥10亿美元、TCI≥0.2、TCI≥0.3、CS≥0.2、CS≥0.3网络的相对度数中心度均值分别增长了53.19%、143.48%、5.61%、39.67%、47.62%、94.59%。第二,除出口≥10亿美元网络外,中国与中东欧其他贸易关系网络的集中化趋势越来越弱。与2005年相比,2017年出口≥1亿美元、出口≥10亿美元、TCI≥0.2、TCI≥0.3、CS≥0.2、CS≥0.3网络的NC指数分别增长了-2.04%、110.53%、-25.00%、-46.60%、-53.66%、-8.57%。除了出口≥10亿美元网络的相对度数中心势指数NC有所增长外,其余几个网络的指标均有所下降。第三,中国在出口关系网络中的集中优势越来越明显,De值排名靠前。在2005年出口≥1亿美元和出口≥10亿美元网络中,与中国有显著出口关系的国家数分别为11个和4个,De值分别为73.33%和26.67%;2017年,中国对中东欧国家出口总量大于1亿美元和10亿美元的国家数分别为13个和11个,De值分别为86.67%和73.33%,显著出口关系明显增加。第四,在贸易互补关系网络中,中国占据重要地位,与中东欧国家的贸易互补性强。在TCI≥0.2网络中,中国2005和2017年的显著关系数均为15,De值为100%;在2017年TCI≥0.3网络中,与中国有显著贸易互补关系的国家数为13,De值为86.67%,虽然排名较2005年明显下跌,但相对度数中心度却增加8.33%,这说明中国与中东欧国家的贸易互补性进一步增强。第五,虽然中国在竞争关系网络中并不处于中心位置,但与中东欧国家的贸易竞争关系呈逐渐增强的趋势。2005年,中国与中东欧国家竞争指数大于0.2和0.3的国家分别为4个和2个,相对度数中心度De值分别为26.67%和13.33%;2017年竞争指数大于0.2和0.3的国家分别为12个和7个,De值分别为80.00%和46.67%。说明随着时间变化,中国与中东欧国家的贸易竞争关系越来越激烈。
-
1976年,Boorman & White提出了块模型分析方法[19]。本文选择CS≥0.3网络和TCI≥0.3网络,运用CONCOR(Convergence of iterated Correlations)方法,进行块模型分析。根据李敬、陈澍等[20]以及李敬、陈旎等[1],将各贸易板块作如下判定:内部型板块的显著贸易关系主要发生在板块内各国,该板块对其他板块较少产生贸易关系;外部型板块的显著贸易关系主要发生在该板块与其他板块间,而板块内各国较少发生贸易关系;兼顾型板块是指显著贸易关系同时发生在板块内部与各板块之间;孤立型板块则表示显著贸易关系在板块内部和外部都较少发生。
1.贸易互补关系网络块模型
2005年TCI≥0.3网络块模型分析显示(见表 3),该贸易网络被分成4个板块,第一、四块板属于外部型板块。其中,第一板块由阿尔巴尼亚、波黑、马其顿3国组成,板块内贸易关系数较少,但以第三板块国家出口计算的TCI≥0.3的贸易关系数较多,这表明第一板块各国的进口与第三板块内国家的出口结构相匹配。第四板块由立陶宛和罗马尼亚组成,虽然两国内部贸易结构并不互补,但其产品出口与第二板块内国家的产品进口互补性强;同时两国的进口与第三板块国家的出口结构匹配度高达100%。第二和第三板块均属兼顾型板块。其中,第二板块由克罗地亚、保加利亚、爱沙尼亚、拉脱维亚、斯洛文尼亚和塞尔维亚6国组成,板块内部密度为0.700,说明板块内各国出口结构高度互补;同时,以第三板块和第四板块国家出口计算的TCI≥0.3的贸易关系数较多,说明第二块板的进口与第三、四板块的出口结构相似度高。第三板块包括捷克、斯洛伐克、匈牙利、波兰和中国,板块内部密度为0.800,表明板块内各国的贸易结构高度互补;且与第一、二、四板块呈强势互补关系。
2017年TCI≥0.3网络块模型分析结果显示(见表 4),该网络的4个板块中,有两个都仅由一个国家组成,分别是第一板块(阿尔巴尼亚)和第四板块(中国),所以这两个板块内部不构成网络密度。第二板块属于外部型板块,由波黑和马其顿组成,两国之间互补关系不显著,但以第三板块出口计算的TCI≥0.3的贸易关系数较多。因此,波黑和马其顿为第三板块中的中东欧国家提供了非常大的出口机会,其被动性互补关系十分显著。第三板块属于兼顾型,由克罗地亚、捷克、爱沙尼亚、保加利亚、拉脱维亚、立陶宛、波兰、罗马尼亚、塞尔维亚、斯洛伐克、斯洛文尼亚和匈牙利组成,板块内部密度为1,说明板块内国家之间的进出口结构完全吻合。同时,第三板块国家与第二板块国家的贸易互补关系也十分显著。此外,板块内各国的进口与中国的出口匹配度高达100%。
基于2005和2017年TCI≥0.3网络块模型分析结果,除波黑、阿尔巴尼亚和马其顿外,中国与其他中东欧国家间的贸易互补关系非常显著。以中国出口计算的TCI值和以他国出口计算的TCI值均显示出很强的贸易互补性。因此,中国在这些中东欧国家的贸易互补关系中占据主导地位,具有强势进出口能力。虽然波黑、阿尔巴尼亚、马其顿进出口能力较弱,但其进口需求与中国的出口结构匹配,为中国产品出口创造了机会。
2.贸易竞争关系网络块模型
2005年CS≥0.3网络块模型分析结果显示(见表 5),该网络有4个板块。第一板块由阿尔巴尼亚和波黑构成,块板内无显著贸易竞争关系;同时,与其他板块也不产生激烈的贸易竞争,因此该板块为孤立型。第二板块为兼顾型,这一板块有7个国家,分别是匈牙利、中国、捷克、爱沙尼亚、斯洛伐克、波兰和斯洛文尼亚;板块内密度高达0.714,说明这7个国家之间贸易竞争十分激烈;同时,第二与第三块板之间也存在显著贸易竞争关系,但板块内部之间的竞争更为激烈。第三板块仍为兼顾型,由保加利亚、罗马尼亚、拉脱维亚和立陶宛4国组成,板块密度为1,说明4国之间的贸易竞争已白热化;同时,第三板块与第二、四板块之间的贸易竞争也非常激烈。第四板块包括克罗地亚、马其顿、塞尔维亚3国,属于外部型板块,板块内国家之间不存在显著贸易竞争关系,激烈的贸易竞争关系主要发生在与第三板块国家之间。因此第二和第三板块国家是中国的主要贸易竞争对手。
2017年CS≥0.3网络块模型分析结果显示(见表 6),2017年贸易竞争的基本格局发生了变化,块模型分析仅显示三个块板。其中,第一个板块为孤立型,由阿尔巴尼亚和马其顿组成,板块内部和外部的贸易竞争均不激烈。第二板块为外部型板块,由波黑、爱沙尼亚、捷克、匈牙利、立陶宛和斯洛伐克组成;板块内部贸易竞争关系并不激烈,显著的贸易竞争关系主要发生在与第三板块国家间。第三板块则均为兼顾型板块,其板块内密度为0.821,不仅板块内部竞争高度白热化,且与第二板块之间的竞争也十分激烈。第三板块由克罗地亚、拉脱维亚、波兰、塞尔维亚、保加利亚、斯洛文尼亚、罗马尼亚和中国组成。
根据2005年和2017年竞争关系网络块模型分析发现,除阿尔巴尼亚和马其顿外,中国与中东欧国家贸易竞争激烈。与2005年相比,2017年,中国与波黑、克罗地亚和塞尔维亚3国产生了较为明显的贸易竞争;与波兰、匈牙利、捷克、爱沙尼亚、斯洛伐克、斯洛文尼亚、保加利亚、罗马尼亚、拉脱维亚和立陶宛之间的贸易竞争更加激烈。尽管如此,中国仍不处于整个贸易竞争网络的中心位置。
一. 中国与中东欧国家贸易关系网络构建
二. 中国与中东欧国家贸易关系网络密度分析
三. 中国与中东欧国家贸易关系网络中心性
四. 中国与中东欧国家贸易关系网络块模型
-
本文基于社会网络分析视角,研究了2005年至2017年以来中国与中东国家货物贸易的竞争互补关系及动态变化,结论如下:(1)2005至2017年,中国与中东欧国家货物进出口贸易额年均增速快于中国对“一带一路”沿线国家和对全球贸易的年均增长速度。中国对各国的货物出口成倍高于进口。同时,无论是进出口经济体还是产品结构,都体现出高度集中化趋势。(2)近年来,中国与中东欧国家之间的贸易关系日趋增强,贸易网络密度明显增加,但各种贸易关系向少数国家集中的趋势越来越弱。(3)在中国与中东欧国家的贸易互补关系网络中有一个重要的板块,由阿尔巴尼亚、波黑和马其顿组成,尽管各国进出口能力较弱,但却为中国提供了潜在的出口空间。(4)中国与中东欧国家的贸易竞争主要发生在板块内部。2005年,中国与板块内部的匈牙利、捷克、爱沙尼亚、斯洛伐克、斯洛文尼亚、波兰竞争最为激烈;2017年,这一板块国家变为斯洛文尼亚、波兰、克罗地亚、拉脱维亚、塞尔维亚、保加利亚和罗马尼亚。(5)中国与各国的贸易进出口结构高度互补,在贸易互补关系网络中,中国占据主导地位。虽然中国在贸易竞争关系网络中的密度越来越大,但仍不处于网络中心位置。总体上,贸易互补大于贸易竞争,因此中国与中东欧国家之间具有较大的经贸合作空间。
本研究的政策含义是,大力推动中国与中东欧国家的贸易合作,潜力和阻碍并行。目前,中东欧各国对外贸易还是以欧盟为主,对中国市场较少依赖;而且,中东欧的各国处于“一带一路”最远端,与我国的贸易关系受到运输距离的限制;同时,中东欧各国进出口商品结构与我国具有较高的相似性。然而,欧债危机之后,中东欧国家“向东看”的外交政策不断强化,与中国开展更多经贸合作的愿望日益迫切。中国与中东欧“16+1合作”与“一带一路”倡议,为中国和中东欧各国的贸易合作打开了新的“机遇之门”。首先,欧洲是中国产品的重要消费市场,中国应充分发挥中东欧的特殊地理位置和市场条件,并深度熟悉欧盟市场规则,促使中国企业和产品进入欧洲。二是要充分挖掘中国与波兰、捷克、匈牙利等国的产业互补优势,充分发挥优势产业的带头作用和联动效应。同时,进一步发挥中国在贸易互补板块中的主导作用,加大对斯洛伐克、斯洛文尼亚、阿尔巴尼亚等国的出口;避免与波兰、匈牙利、捷克、爱沙尼亚等竞争板块内国家的过度竞争。三是取得与中东欧国家技术和资源上的深度合作,积极开展各国地方政府间的特色合作;同时将“创新”作为合作的潜在增长点,提高合作的战略关联度和依存度。总之,中国和中东欧国家政治上互信,贸易上互补,贸易潜力较大,未来合作大有可为。


 下载:
下载:
