-
开放科学(资源服务)标志码(OSID):

-
跨期套利是利用同一种期货品种、不同到期时间合约间价差的不寻常变动,进而实施反向交易,在两个合约间价差回归常态时进行平仓获利的投资方式. 相对于股票等金融工具的买入并持有策略而言,跨期套利由于交易的是同一种期货品种不同合约之间的价差,相对风险更低. 相对于跨品种或者跨市场套利,跨期套利的合约价差更为稳定,因此投资的稳定性更高,风险也相对较低. 跨期套利在价差超过正常值较远的时候进行反向交易,单笔利润相对于买入持有的趋势投资策略往往更低,由于期货市场具有较高的杠杆属性,且T+0的交易模式使得交易频率可以更高,致使套利交易的风险调整后收益往往更高[1-4],致使越来越多的基金公司在实践中引入套利交易. 同时,套利交易与买入持有策略间的相关性极低甚至为负,因此是分散投资风险及规避尾部风险的重要手段,如2020年年初新冠肺炎疫情导致全球股票市场、债券市场、商品市场均发生了大幅回撤,如果在投资组合中加入套利交易,则可以对尾部风险进行极为有效的控制.
对价差的准确预测是跨期套利成功实施的关键所在,现有绝大部分文献及实际投资者均是利用价差均值回复原理的标准距离法设计策略,即当价差超过合理范围(常见的为均值±1倍或多倍标准差)的时候进行反向交易,待价差回到均值附近时进行平仓[5-7]. 随着机器学习模型在金融预测领域应用得越来越广泛、且预测精度高,众多学者和投资者利用机器学习模型对价差进行预测,并在预测价差超过一定阈值后进行交易,从而获得套利收益. 常用来进行套利交易的机器学习模型包括人工神经网络[8-12]、支持向量机[13-14]和随机森林[15]等.
但是,直接对价差进行预测无疑丧失了许多细节信息,如熊志斌[16]和周亮[17]对人民币汇率的研究均发现,用ARIMA模型预测线性部分、用机器学习模型预测非线性部分或残差部分能够实现对离岸人民币汇率更精准的预测. Huang等[18]提出的经验模态分解(EMD)模型在工程信号领域有着广泛的应用,该模型可以将信号分解为多个本征模函数(IMF)及残差项,每个本征模函数及残差项均有自身的特征益于分析及预测. 自EMD模型提出后,众多学者将该模型应用于经济问题分析,包括原油价格分析[19-20]、环境问题分析[21-23]等,相对于对原始数据的直接分析,利用分解信号进行分析的研究结果更为准确和稳健.
本文拟采用EMD模型对沪深300股指期货当月合约与下月合约的价差进行分解,并利用神经网络、支持向量机、随机森林以及ARIMA模型分别对高频和低频信号进行预测,再从预测准确性及套利绩效两个方面来评估模型的优劣. 相较于已有期货跨期套利的文献,本文的主要创新之处在于:①通过EMD模型对原始价差变动序列进行滚动分解,再利用各机器学习模型对分信号进行预测,相对于纯机器学习预测模型,对序列信号考虑得更加周全和完整,也大幅提高了模型的预测精度及套利绩效;②通过将多个机器学习模型及线性的时间序列模型进行比较及综合,既挑选出了更适用于跨期套利的模型,同时也将线性模型和非线性模型整合,在增加模型套利绩效的同时,也增加了机器学习模型的经济解释能力.
全文HTML
-
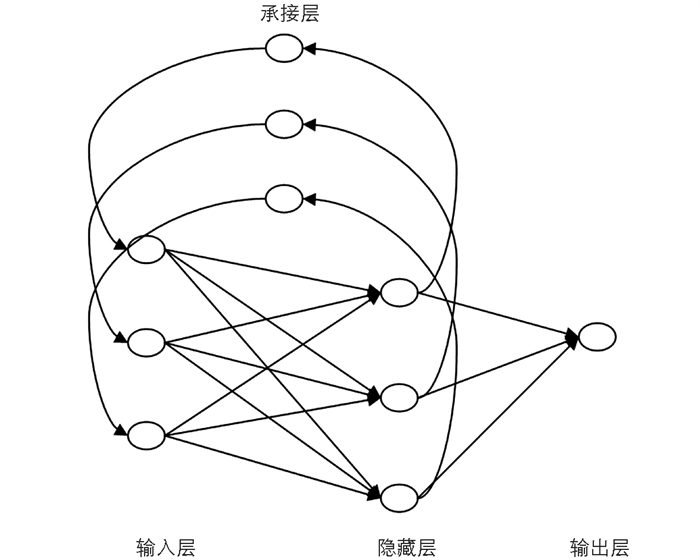
Elman神经网络是一种简单的循环神经网络,在众多学者的研究中均表现出超过普通反馈神经网络(如BP网络)的特征[12, 24]. Elman神经网络除了常见的输入层、隐藏层和输出层之外,在隐藏层的输入和输出之间增加了一个承接层,该模块存储了隐藏层的输入信号,再作为输入变量影响隐藏层的下期输入,具体结构如图 1所示.
Elman神经网络的传导公式为:
式(1)中,w1,w2,w3分别表示承接层到隐藏层、输入层到隐藏层及隐藏层到输出层之间的连接权重;u为输入向量,x和x c分别为隐藏层和承接层的输出向量;f1(·)为隐藏层的激励函数,f2(·)为输出层的激励函数,本文采用常见的sigmod激励函数,由于实证中输入层包括20个节点,因此我们将隐藏层设置为40个节点.
-
随机森林(RF)是一种集成学习方法,它的基本单元是决策树,每棵决策树都是一个分类器. 随机森林只关注树的集成学习,在树的集成(森林)产生之后,该模型使用投票的方法来组合预测结果,将投票次数最多的类别指定为最终的输出. 随机森林可以处理大量的数据,而大数据中所谓的“维数灾难”常常会让其他模型失败,同时随机森林对于大多数学习任务的误差率几乎和其他方法处于同等水平,并具有更少的过度拟合倾向. 本文中随机森林采用500颗决策树进行分析.
-
SVM模型的目标是最大化支持向量与超平面之间的距离. SVM基于预测函数f(·)设置了一个通道ε. 如果数据点在通道之内,则损失函数为零;如果数据点在通道之外,则损失函数设为
$\left| {{y^i} - f\left( {\omega , {x^i}} \right)} \right| - \varepsilon $ . 二次规划问题可以设置为:式(2)中,ξi与ξ*i为松弛因子,当数据点在通道内时为零. 通过引入拉格朗日乘子(αi1和αi2),根据KKT(Karush-Kuhn-Tucker)条件,得到预测模型为:
式(3)中, k(xi,x*)为核函数,将原始数据的非线性特征映射到高维空间,从而能够采用线性关系来对数据进行预测,本文采用实证中最常见的RBF(Radial Basis Function)径向基核函数.
-
EMD是一种非线性、非平稳数据处理方法,它假定数据根据其复杂性可能同时存在多种振荡模式. EMD可以基于数据本身的局部特征,从原始时间序列提取出本征模函数(IMF),它满足以下两个条件:①函数的极值和零交叉数相同,或最多相差1;②函数关于局部零均值是对称的. 这两个条件确保IMF近似周期性的函数,并且均值为零. IMF是一种类似谐波的函数,但在不同时间具有可变的幅度和频率.
EMD具体计算步骤如下:①确定时间序列x(t)的所有极大值和极小值. ②用3次样条插值生成其上下包络emin(t)和emax(t). ③计算上下包络的逐点平均值m(t)=(emin(t)+emax(t))/2. ④将x(t)和m(t)之差定义为d(t)=x(t)-m(t). ⑤如果d(t)是IMF,则将d(t)表示为第i个IMF,并用残差r(t)=x(t)-d(t)替换x(t),第i个IMF通常表示为ci(t);如果d(t)不是IMF,则用d(t)替换x(t). ⑥重复步骤①至步骤⑤,直到残差项满足某种停止标准为止.
Huang等[25]指出提取IMF的停止标准为:残差项满足零交叉数和极值相差不超过一个,并且可以满足下列预定标准:成分ci(t)或残差项r(t)小于实际结果的预定值,或者残差项r(t)变成单调函数,无法再提取IMF. IMF的总数一般限制为log2N,其中N是数据序列的长度. 原始时间序列可以表示为所有IMF和残差项的总和.
式(4)中N是IMF的数量,r(t)是最终的残差项.
EMD往往分解出来的IMF信号比较多,如果对每个信号进行建模,无疑会加大计算机的运算难度,从而导致计算时间过长,因此我们借鉴Zhang等[22]的方法,将所有的IMF合成高频和低频两个部分,实现信号重构. 具体计算步骤为:①计算每个成分(残差项除外)的c1(t)到ci(t)之和的平均值;②使用T检验确定均值显著偏离零的i;③在均值发生突变的变化点,使用IMF从该位置进行部分重建,分别合成低频部分和高频部分,即用c1(t)到ci(t)合成高频部分,用ci+1(t)到cN(t)合成低频部分.
-
为了对模型预测绩效进行评估,本文除选择常见的RMSE,MAE及Theil-U进行评估外,还选择了方向预测准确度DAR及样本外预测ROS2,计算公式分别如式(5)至式(9)所示.
式(5)-式(9)中,yi,
${\hat y_i}$ ,${\bar y_i}$ 分别表示实际值、模型预测值及样本内滚动均值. RMSE,MAE及Theil-U越小,模型预测效果越好;DAR介于[0, 1]之间,数值越大模型预测效果越好;ROS2是实证研究中常用来衡量样本外绩效的指标,其值介于(-∞,1]之间,数值越大模型预测效果越好. -
本文利用机器学习的预测结果来构造跨期套利策略,当模型预测下期价差与当期价差的差值大于α时,则买入当月合约,卖出下月合约;当模型预测下期价差与当期价差小于-α时,则卖出当月合约,买入下月合约;当持有套利组合且模型预测值的绝对值小于α时平仓. 股指期货的杠杆是10倍,交易手续费为0.23%%,样本区间内两个合约的均价在3 150附近,因此我们假定每单位交易手续费为0.15元. 考虑到期货市场杠杆率较高、风险较大,当出现套利机会时,我们只采用75%的资金进行滚动套利.
1.1. 机器学习模型
1.1.1. Elman网络
1.1.2. 随机森林
1.1.3. 支持向量回归
1.2. 经验模态分解(EMD)
1.3. 模型绩效评估
1.4. 套利模型设计
-
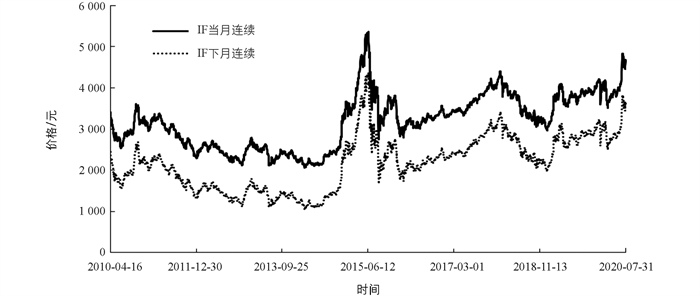
为了检验机器学习融合经验模态分解的跨期套利策略的可行性,本文选择沪深300股指期货的当月连续合约和下月连续合约进行分析,由于沪深300股指期货(以下简称IF合约)2010年4月16日才上市,因此最终选择了IF当月连续和下月连续合约2010年4月16日-2020年7月31日的所有日数据进行分析,共2 503个交易日. 图 1报告了两个合约在样本区间的走势,左轴为IF当月连续合约价格曲线,右轴为IF下月连续合约价格曲线. 由图 1可以看到,两者走势几乎一致,计算发现两者相关系数高达0.999,两者的价差在-130~70之间波动(99%置信区间),存在着跨期套利的可行性.
-
采用3种机器学习方法(Elman网络、RF、SVM)及ARIMA模型对价差变动进行预测. 对于机器学习模型,采用前20期的数据(t-20至t-1期)作为输入变量来预测第t期的价差;对于ARIMA则根据自相关系数(ACF)和偏自相关系数(PACF)确定模型的参数,并向前一步预测第t期的价差. 所有模型均采用1 000个滚动样本进行建模,即第1 001个价差变动数据是利用1~1 000个价差变动数据进行建模;第1 002个价差变动数据是利用2~1 001个价差变动数据进行建模,依次类推. 表 1报告了4个模型的预测效果,可以看到SVM模型的RMSE、Theil-U指数和ROS2表现最佳;ARIMA模型的MAE和DAR表现最优;Elman模型表现相对较差,其ROS2甚至为负,说明用Elman进行预测略逊于用样本内均值进行预测的效果;RF模型虽然整体误差较SVM模型略高,但是其DAR却略优于SVM模型,这与其他很多研究相似,由于RF模型集成了多个决策树,表现出的结果更为稳健.
-
采用不同的α阈值进行套利,表 2报告了4个模型的套利结果,其中Panel A是α=1时的套利效果,Panel B是α=4时的套利效果,Panel C是α=8时的套利效果. 第2至第5列分别报告了基于Elman,RF,SVM及ARIMA模型预测结果的套利效果,为了避免单一模型进行预测时的弊端,第6列和第7列综合了RF模型和ARIMA模型预测结果进行套利. 本文采用RF模型是因为其表现较为稳健,预测效果介于Elman和SVM之间;综合一个非线性的机器学习模型(RF)和一个线性的时序预测模型(ARIMA),预期会增加套利模型的稳健性;第6列是将两个模型预测值进行平均,第7列是只有两个模型预测值都超过阈值时才进行套利.
由表 2可知,所有模型在任何阈值下均能取得较高的套利收益,收益率最高的是ARIMA模型在α=1时,年化收益率高达46.29%;胜率最高的是SVM模型在α=8时,胜率高达91.67%,但是其交易时间很短,仅交易了0.81%的样本时间,即仅交易了12次,其他所有模型的胜率均在57%以上,说明机器学习在进行股指期货跨期套利时,总体胜率均不错;最大回撤最低值是SVM模型在α=8时,仅回撤了0.02%,同时可以看到,绝大部分模型最大回撤均能控制在20%以内,说明套利模型风险控制较好;所有模型的波动率均低于33%,下行波动率均低于16%,因此模型夏普比率和索提诺比率均较好. 夏普比率最高的是SVM模型在α=1时,高达1.857 9;索提诺比率最高的是SVM模型在α=8时,高达383.06,但是由于此时交易量过低导致下行波动率极低,索提诺比率次高的是SVM模型在α=1时,达到了4.498 6. 从第6列和第7列可以看出,相对于仅采用RF或ARIMA进行预测,混合模型的风险控制更好,表现为更低的波动率、下行波动率以及最大回撤,尤其是第7列,只有当两个模型预测值均大于阈值时才进行套利,风险控制更为出色,说明将非线性模型和线性模型融合使用能够改善模型的风险控制能力,在实践中可能应用价值更高. 实际上,采用SVM与ARIMA相结合的模型风险控制更佳,限于篇幅,结果未列出.
-
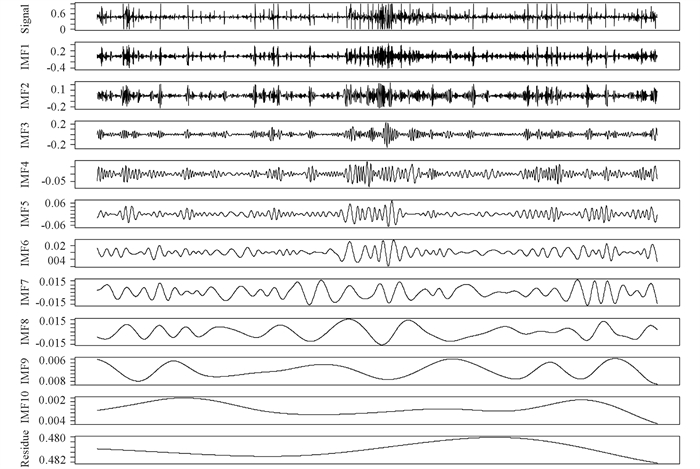
为了更好地了解跨期价差的微观结构,提高跨期套利的绩效表现,本文采用EMD模型对原始价差变动数据进行信号分解(图 2). 由图 2可知,EMD模型将原始信号分成了10个IMF信号及1个残差信号,从IMF1-IMF10分别表示从高频到低频的本征模函数. 图 2中越低频的信号越平稳,IMF10及残差信号已经变成了一条非常平滑的曲线. 由于对所有序列进行建模会加大计算机的工作量,本文后面的分析将借鉴Zhang等[22]的方法,将所有IMF合成一个高频信号和一个低频信号,其中高频信号波动剧烈,与原始信号相似性较强,而低频信号及残差信号则表现出较强的线性特征.
图 2是将整个样本区间的价差变动进行分解,如果直接对其进行分析,则在套利过程中用到了未来信息,这显然不符合实际情况,因此本文采用滚动窗口来进行信号分解,即在训练机器学习模型的滚动窗口区间(1 000个数据)进行EMD分解,借鉴Li等[22]的方法,将多个IMF合成一个高频信号和一个低频信号,然后分别利用Elman,RF,SVM和ARIMA这4种模型来对高频信号、低频信号及残差信号进行预测,再将3个信号的预测值汇总得到最终的价差变动预测值. 表 3报告了EMD分解信号的预测结果,其中Panel A报告了模型的预测效果,Panel B报告了α=1时的套利结果(限于篇幅,这里仅报告了α=1时的结果). 从Panel A可知,Elman网络的预测效果较差,其ROS2远小于0,说明效果不及利用均值的预测效果,RF,SVM和ARIMA的预测效果相对较好,因此在Panel B中本文仅采用了RF,SVM和ARIMA这3种模型进行套利. 同时,本文还报告了RF与ARIMA平均值及两者同时超过阈值的综合模型的套利结果. 将Panel B的结果与表 2进行比较可以发现,除了SVM模型套利的风险有所提高外,其他模型的风险均与表 2大体相当,但是所有模型的收益率都有了大幅度上升,尤其是ARIMA、平均模型及综合模型,从而使得模型的夏普比率和索提诺比率均有较大幅度上涨. 表现最好的是EMD-ARIMA模型,其年化收益率高达96.52%,夏普比率和索提诺比率分别高达2.854 9和8.271 1.
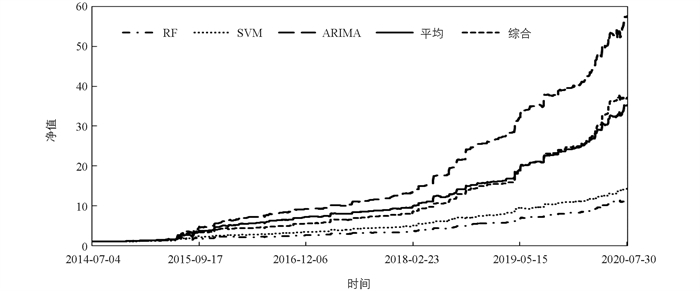
图 3展示了套利模型的净值走势图. 图 3总体来看,各曲线均能保持较平稳的上升趋势,尤其是EMD-ARIMA模型,最终净值接近60,平均模型和综合模型也获得了较高的回报,最终净值均在30以上. 综合来看,跨期套利相对于买入持有策略,风险更低(绝大部分股票指数的年化波动率均在30%以上,最大回撤一般在50%以上,个股的波动率和最大回撤更高),如果能够选择到合适的套利模型,同样能够获得非常高的投资收益,进而大幅提高投资的风险调整后收益.
-
为了检验研究结论的稳健性,本文将整个套利区间划分为两个时间相等的分样本,各包括3年时间,分别是2014年7月-2017年7月、2017年8月-2020年7月. 表 4报告了分样本检验结果,其中Panel A和Panel B是2014年7月-2017年7月的套利结果,Panel C和Panel D是2017年8月-2020年7月的套利结果;Panel A和Panel C仅采用了机器学习模型,Panel B和Panel D采用了机器学习与EMD相结合的套利模型(限于篇幅,同样仅报告了α=1时的套利结果). 由表 4可以看到与全样本相似的结果,无论是2017年7月以前还是以后,机器学习加EMD模型的套利风险虽然与纯机器学习模型相当,但其套利收益却要显著高于纯机器学习模型(除第一阶段RF+EMD的投资收益相对RF模型略有降低外),从而使得机器学习加EMD模型的夏普比率和索提诺比率均显著高于纯机器学习模型,本文的研究结论稳健. 从表 4还可知,相对于2017年7月之前,2017年7月之后的套利收益有所下降,套利风险也有所降低,这也间接说明随着期货市场的不断发展,市场有效性在逐步提高,从而使得套利空间有所收窄.
-
表 3和表 4的分析均是基于EMD分解后再将多个本征模函数合成一个高频信号和一个低频信号,这样的操作方式可以极大地提高计算机的运算速度,但是也会丧失较多的信号信息,因此本文利用RF,SVM和ARIMA分别对每个本征模函数及残差信号进行预测,再综合为最终的预测值. 相对于合成两个信号,这种方法利用到了更多的信息,但是运行速度慢了约5倍. 表 5报告了对每个分解信号单独进行预测的套利结果,其中Panel A是模型的预测偏差,Panel B是基于预测值的套利结果,同样仅报告了α=1时的套利绩效. 与表 3相比较可知,基于EMD所有信号的套利模型,RF模型和SVM模型的预测精度有所提高,ARIMA略有下降. 所有模型的投资收益均有一定幅度的上升,波动率也略有上升,而下行波动率反而有所下降(除SVM模型略有上升),因此模型的夏普比率和索提诺比率均大幅上升,同时模型的胜率也显著提高. 总体来看,基于EMD所有信号预测值的套利模型相对于将信号合成高频和低频的模型,投资绩效又有了一定程度的上升,只是损失了计算机的运行速度,在实际投资过程中可能会因价格变动过快而导致实际投资收益与回测收益有一定的偏差,比较适合于较低频率及较稳定市场的套利投资.
-
为了进一步检验研究结论的稳健性,本文还对商品期货进行了检验. 螺纹钢是商品期货中交易量最大的品种,因此选择螺纹钢期货2020年8月和2020年9月到期合约的30 min数据进行分析,为了避免合约刚上市及快要交割时价格波动幅度过大的弊端,本文选择了这两个合约2019年10月15日-2020年7月15日的所有30 min数据,共2 190组. 同样滚动采用1 000组数据来进行建模,通过EMD进行分解后将信号合成高频和低频两部分,并分别利用RF,SVM和ARIMA进行预测并整合. 表 6报告了机器学习+EMD套利结果,其中Panel A是模型的预测结果,Panel B是模型的套利效果.
由表 6可知,3个模型均能对螺纹钢期货的价差变动进行较好的预测,且基于预测值的套利模型能够取得非常不错的套利绩效. ARIMA模型的套利绩效最优,其夏普比率和索提诺比率分别高达4.45和11.07;而综合模型的套利风险最低,下行波动率和最大回撤分别为8.88%和5.77%. 总体来看,EMD分解能够改善机器学习模型的套利绩效,而将线性ARIMA模型和非线性机器学习模型结合使用的综合模型,能够更好地控制投资风险,是更为稳健的投资方式.
2.1. 样本描述
2.2. 基于机器学习的预测和套利
2.2.1. 预测效果
2.2.2. 套利分析
2.3. EMD分解及机器学习预测
2.4. 分样本稳健性检验
2.5. EMD全分解滚动套利效果
2.6. 商品期货跨期套利研究
-
选择IF当月连续和下月连续合约2010年4月16日-2020年7月31日的所有日数据,利用3种机器学习方法(Elman,RF,SVM)及ARIMA模型对两个合约的价差变动序列进行预测并构建套利模型. 研究结果发现:① SVM和ARIMA模型的预测精确度相对较高,Elman模型表现较差,而RF模型由于集成了多个弱分类器,表现出的结果较为稳健. ②所有模型在任何阈值下均能取得较高的套利收益,同时绝大部分模型最大回撤均能控制在20%以内,波动率均低于33%,下行波动率均低于16%,说明套利模型风险控制较好;相对于仅采用RF或ARIMA进行预测,混合模型(将预测值进行平均或作为并列条件)的风险控制更好,表现为更低的波动率、下行波动率及最大回撤,说明将非线性模型和线性模型融合使用能够改善模型的风险控制能力. ③将机器学习预测与EMD分解技术相融合可以在不提高风险的同时大幅提高模型的收益率,从而使得模型的夏普比率和索提诺比率均有较大幅度上升,表现最好的是EMD-ARIMA模型,其年化收益率高达96.52%,夏普比率和索提诺比率分别高达2.854 9和8.271 1. ④分样本检验、全IMF信号预测及基于商品期货市场的套利分析,均证明融合EMD的机器学习模型可以获得比纯机器学习模型更优异的套利效果.
本文的研究结论不仅是对期货投资理论及人工智能方法在金融领域中应用的补充,同时也具有较强的实践价值:①跨期套利是一种有效的投资策略,相对于买入持有等基于价格预测的投资策略,套利策略的风险更低,如果方法得当,收益却反而可能获得提高. 同时,大量理论研究及实践均证明,商品期货策略(尤其是套利策略)与股市等投资策略的相关性极低甚至为负,因此在股票投资策略中增加跨期套利策略,可以有效降低整体投资组合的风险,从而提高投资收益率,并且可以在极端的市场风险下保护资产的安全性. ②机器学习模型在对非线性金融时间序列数据进行预测时具有较好的效果,但是机器学习模型完全由数据驱动,其经济基础较为薄弱,因此将其与经济基础更为稳健的线性预测模型相结合,可以在提升模型预测能力的同时,增加模型的经济解释能力. ③金融时间序列具有较高的复杂性及噪声比率,采用单一模型进行预测无疑会丧失很多信息,通过EMD等信号分解模型将金融时间序列进行分解,通过趋势成分或波动成分的提取分别进行预测,可以实现对金融时间序列更为准确的预测,并进而提升跨期套利成功的几率.


 下载:
下载:


