Message Board

Dear readers, authors and reviewers,you can add a message on this page. We will reply to you as soon as possible!

2026 Volume 48 Issue 2
Article Contents

LUO Yiwei, LIU Hongjiang, LI Wei, et al. Classification of Medicinal Mulberry Leaf and Prediction of Chlorophyll Content[J]. Journal of Southwest University Natural Science Edition, 2026, 48(2): 1-16. doi: 10.13718/j.cnki.xdzk.2026.02.001
Citation: LUO Yiwei, LIU Hongjiang, LI Wei, et al. Classification of Medicinal Mulberry Leaf and Prediction of Chlorophyll Content[J]. Journal of Southwest University Natural Science Edition, 2026, 48(2): 1-16. doi: 10.13718/j.cnki.xdzk.2026.02.001

Classification of Medicinal Mulberry Leaf and Prediction of Chlorophyll Content

More Information
  • Corresponding author: HE Ningjia
  • Received Date: 25/04/2025
    Available Online: 20/02/2026
  • MSC: S88;TP181

  • To advance the construction of a factory-based precision management system for medicinal mulberry, this study first established hyperspectral reflectance-based classification models for leaves under distinct physiological conditions. Subsequently, chlorophyll content prediction models were developed. During the model construction, 3 sample set division methods, 5 data preprocessing methods, and 5 machine learning algorithms were systematically compared. Results of medical mulberry leaf classification indicated that the support vector machine (SVM) models using random database (RD) with either raw data or multiplicative scatter correction (MSC) for sample partitioning-specifically, the RD-RAW-SVM and RD-MSC-SVM-achieved the best R2 values of 0.954 on the test set. Confusion matrix analysis revealed that the classification accuracies for healthy, infested, and shaded leaves were identical across the two different models, yielding 96%, 93%, and 98%, respectively. Nutrient-deficient leaves correctly classified with accuracies of 96% and 97% in the two models. For chlorophyll content prediction, the partial least squares (PLS) model using RD combined with baseline correction (BC)-specifically, RD-BC-PLS-demonstrated optimal performance, with a testing set R2 of 0.895 and root mean square error (RMSE) of 3.461. Additionally, weight analysis identified two critical wavelengths (505 nm and 734 nm) contributing maximally to chlorophyll content prediction, enabling the derivation of novel spectral indices. Comparative evaluation with 19 conventional vegetation indices revealed that the red-edge normalized difference vegetation index (NDVI705) and the newly developed MFD734-505 exhibited equivalent predictive efficacy for chlorophyll estimation, with a testing set R2 of 0.864. This integrated modeling framework provides an important foundation for the precise monitoring and intelligent management of factory-based medicinal mulberry cultivation.

  • 加载中
  • [1] OH K S, YONG R, LEE S, et al. Melanin-Concentrating Hormone-1 Receptor Antagonism and Anti-Obesity Effects of Ethanolic Extract from Morus Alba Leaves in Diet-Induced Obese Mice [J]. Journal of Ethnopharmacology, 2009, 122(2): 216-220. doi: 10.1016/j.jep.2009.01.020

    CrossRef Google Scholar

    [2] ZHAO T T, CHEN Q R, CHEN Z, et al. Anti-Obesity Effects of Mulberry Leaf Extracts on Female High-Fat Diet-Induced Obesity: Modulation of White Adipose Tissue, Gut Microbiota, and Metabolic Markers [J]. Food Research International, 2024, 177: 113875. doi: 10.1016/j.foodres.2023.113875

    CrossRef Google Scholar

    [3] NAOWABOOT J, PANNANGPETCH P, KUKONGVIRIYAPAN V, et al. Mulberry Leaf Extract Restores Arterial Pressure in Streptozotocin-Induced Chronic Diabetic Rats [J]. Nutrition Research, 2009, 29(8): 602-608. doi: 10.1016/j.nutres.2009.06.002

    CrossRef Google Scholar

    [4] LV Q Y, LIN J R, WU X Y, et al. Novel Active Compounds and the Anti-Diabetic Mechanism of Mulberry Leaves [J]. Frontiers in Pharmacology, 2022, 13: 986931. doi: 10.3389/fphar.2022.986931

    CrossRef Google Scholar

    [5] JIANG Y, NIE W J. Chemical Properties in Fruits of Mulberry Species from the Xinjiang Province of China [J]. Food Chemistry, 2015, 174: 460-466. doi: 10.1016/j.foodchem.2014.11.083

    CrossRef Google Scholar

    [6] KRUTHIKA H S, RUKMANGADA M S, NAIK V G. Genome Size, Chromosome Number Variation and Its Correlation with Stomatal Characters for Assessment of Ploidy Levels in a Core Subset of Mulberry (Morus SPP. ) Germplasm [J]. Gene, 2023, 881: 147637. doi: 10.1016/j.gene.2023.147637

    CrossRef Google Scholar

    [7] 吴曙光, 印玉萍, 丁天龙, 等. 新疆药桑芽接育苗技术探讨[J]. 北方蚕业, 2011, 32(3): 45-46.

    Google Scholar

    [8] 曾其伟, 张超, 陈鸿宇, 等. 药桑Morus nigra在重庆的引种研究[J]. 中国中药杂志, 2016, 41(8): 1450-1455.

    Google Scholar

    [9] LI Y Q, KONG D X, FU Y, et al. The Effect of Developmental and Environmental Factors on Secondary Metabolites in Medicinal Plants [J]. Plant Physiology and Biochemistry, 2020, 148: 80-89. doi: 10.1016/j.plaphy.2020.01.006

    CrossRef Google Scholar

    [10] MIYAGI A, UCHIMIYA H, KAWAI-YAMADA M. Synergistic Effects of Light Quality, Carbon Dioxide and Nutrients on Metabolite Compositions of Head Lettuce under Artificial Growth Conditions Mimicking a Plant Factory [J]. Food Chemistry, 2017, 218: 561-568. doi: 10.1016/j.foodchem.2016.09.102

    CrossRef Google Scholar

    [11] LIU Y, MOUSAVI S, PANG Z, et al. Plant Factory: A New Playground of Industrial Communication and Computing [J]. Sensors (Basel), 2021, 22(1): 147. doi: 10.3390/s22010147

    CrossRef Google Scholar

    [12] CHO K M, LEE H Y, CHO D Y, et al. Comprehensive Comparison of Chemical Composition and Antioxidant Activity of Panax Ginseng Sprouts by Different Cultivation Systems in a Plant Factory [J]. Plants, 2022, 11(14): 1818. doi: 10.3390/plants11141818

    CrossRef Google Scholar

    [13] KIM S H, PARK J H, KIM E J, et al. White LED Lighting Increases the Root Productivity of Panax Ginseng C. A. Meyer in a Hydroponic Cultivation System of a Plant Factory [J]. Biology, 2023, 12(8): 1052. doi: 10.3390/biology12081052

    CrossRef Google Scholar

    [14] LEE J Y, GOTO E, YOSHIDA H, et al. Optimal Harvest-Time to Maximize the Annual Camptothecin Production by Ophiorrhiza Pumila in a Plant Factory with Artificial Light [J]. Journal of Natural Medicines, 2022, 76(4): 865-872. doi: 10.1007/s11418-022-01634-1

    CrossRef Google Scholar

    [15] LIU B, LI R, LI H D, et al. Crop/Weed Discrimination Using a Field Imaging Spectrometer System [J]. Sensors, 2019, 19(23): 5154. doi: 10.3390/s19235154

    CrossRef Google Scholar

    [16] ZHANG Q, ZHENG Y M, YUAN Q Q, et al. Hyperspectral Image Denoising: From Model-Driven, Data-Driven, to Model-Data-Driven [J]. IEEE Transactions on Neural Networks and Learning Systems, 2024, 35(10): 13143-13163. doi: 10.1109/TNNLS.2023.3278866

    CrossRef Google Scholar

    [17] TIAN C X, CHEN Y Z, LIU Y L, et al. Accurate Classification of Glomerular Diseases by Hyperspectral Imaging and Transformer [J]. Computer Methods and Programs in Biomedicine, 2024, 254: 108285. doi: 10.1016/j.cmpb.2024.108285

    CrossRef Google Scholar

    [18] AGUILAR-ARIZA A, SOTTA N, FUJIWARA T, et al. A Multi-Target Regression Method to Predict Element Concentrations in Tomato Leaves Using Hyperspectral Imaging [J]. Plant Phenomics, 2024, 6: 146. doi: 10.34133/plantphenomics.0146

    CrossRef Google Scholar

    [19] LONG T, TANG X Y, LIANG C J, et al. Detecting Bioactive Compound Contents in Dancong Tea Using VNIR-SWIR Hyperspectral Imaging and KRR Model with a Refined Feature Wavelength Method [J]. Food Chemistry, 2024, 460(Pt 2): 140579.

    Google Scholar

    [20] KOH J C O, BANERJEE B P, SPANGENBERG G, et al. Automated Hyperspectral Vegetation Index Derivation Using a Hyperparameter Optimisation Framework for High-Throughput Plant Phenotyping [J]. The New Phytologist, 2022, 233(6): 2659-2670. doi: 10.1111/nph.17947

    CrossRef Google Scholar

    [21] SERRANO-GRIJALVA L, OCHOA-HUESO R, CISKA VEEN G F, et al. Normalized Difference Vegetation Index Analysis Reveals Increase of Biomass Production and Stability during the Conversion from Conventional to Organic Farming [J]. Global Change Biology, 2024, 30(8): e17461. doi: 10.1111/gcb.17461

    CrossRef Google Scholar

    [22] LOI M, LIUZZI V C, FANELLI F, et al. Effect of Different Light-Emitting Diode (LED) Irradiation on the Shelf Life and Phytonutrient Content of Broccoli (Brassica Oleracea L. Var. Italica) [J]. Food Chemistry, 2019, 283: 206-214. doi: 10.1016/j.foodchem.2019.01.021

    CrossRef Google Scholar

    [23] ZIDAN K, MANDI L, HEJJAJ A, et al. Soil Fertility and Agro-Physiological Responses of Maize (Zea Mays) Irrigated by Treated Domestic Wastewater by Hybrid Multi-Soil-Layering Technology [J]. Journal of Environmental Management, 2024, 351: 119802. doi: 10.1016/j.jenvman.2023.119802

    CrossRef Google Scholar

    [24] WANG W, CHENG Y K, REN Y, et al. Prediction of Chlorophyll Content in Multi-Temporal Winter Wheat Based on Multispectral and Machine Learning [J]. Frontiers in Plant Science, 2022, 13: 896408. doi: 10.3389/fpls.2022.896408

    CrossRef Google Scholar

    [25] ZHANG Y, HAN X, YANG J. Selection of Optimal Spectral Features for Leaf Chlorophyll Content Estimation [J]. Scientific Reports, 2024, 14(1): 25598. doi: 10.1038/s41598-024-76872-2

    CrossRef Google Scholar

    [26] TAYLOR B F, DINI P W, KIDSON J W. Determination of Seasonal and Interannual Variation in New Zealand Pasture Growth from NOAA-7 Data [J]. Remote Sensing of Environment, 1985, 18(2): 177-192. doi: 10.1016/0034-4257(85)90047-1

    CrossRef Google Scholar

    [27] JORDAN C F. Derivation of Leaf-Area Index from Quality of Light on the Forest Floor [J]. Ecology, 1969, 50(4): 663-666. doi: 10.2307/1936256

    CrossRef Google Scholar

    [28] HUETE A, DIDAN K, MIURA T, et al. Overview of the Radiometric and Biophysical Performance of the MODIS Vegetation Indices [J]. Remote Sensing of Environment, 2002, 83(1-2): 195-213. doi: 10.1016/S0034-4257(02)00096-2

    CrossRef Google Scholar

    [29] KAUFMAN Y J, TANRE D. Atmospherically Resistant Vegetation Index (ARVI) for EOS-MODIS [J]. IEEE Transactions on Geoscience and Remote Sensing, 1992, 30(2): 261-270. doi: 10.1109/36.134076

    CrossRef Google Scholar

    [30] SIMS D A, GAMON J A. Relationships between Leaf Pigment Content and Spectral Reflectance across a Wide Range of Species, Leaf Structures and Developmental Stages [J]. Remote Sensing of Environment, 2002, 81(2-3): 337-354. doi: 10.1016/S0034-4257(02)00010-X

    CrossRef Google Scholar

    [31] VOGELMANN J E, ROCK B N, MOSS D M. Red Edge Spectral Measurements from Sugar Maple Leaves [J]. International Journal of Remote Sensing, 1993, 14(8): 1563-1575. doi: 10.1080/01431169308953986

    CrossRef Google Scholar

    [32] GAMON J A, PEÑUELAS J, FIELD C B. A Narrow-Waveband Spectral Index that Tracks Diurnal Changes in Photosynthetic Efficiency [J]. Remote Sensing of Environment, 1992, 41(1): 35-44. doi: 10.1016/0034-4257(92)90059-S

    CrossRef Google Scholar

    [33] GITELSON A, MERZLYAK M N. Quantitative Estimation of Chlorophyll-a Using Reflectance Spectra: Experiments with Autumn Chestnut and Maple Leaves [J]. Journal of Photochemistry and Photobiology B: Biology, 1994, 22(3): 247-252. doi: 10.1016/1011-1344(93)06963-4

    CrossRef Google Scholar

    [34] GAO B C. NDWI—A Normalized Difference Water Index for Remote Sensing of Vegetation Liquid Water from Space [J]. Remote Sensing of Environment, 1996, 58(3): 257-266. doi: 10.1016/S0034-4257(96)00067-3

    CrossRef Google Scholar

    [35] MERZLYAK M N, GITELSON A A, CHIVKUNOVA O B, et al. Non-Destructive Optical Detection of Pigment Changes during Leaf Senescence and Fruit Ripening [J]. Physiologia Plantarum, 1999, 106(1): 135-141. doi: 10.1034/j.1399-3054.1999.106119.x

    CrossRef Google Scholar

    [36] HUETE A R. A Soil-Adjusted Vegetation Index (SAVI) [J]. Remote Sensing of Environment, 1988, 25(3): 295-309. doi: 10.1016/0034-4257(88)90106-X

    CrossRef Google Scholar

    [37] GITELSON A A, GRITZ Y, MERZLYAK M N. Relationships between Leaf Chlorophyll Content and Spectral Reflectance and Algorithms for Non-Destructive Chlorophyll Assessment in Higher Plant Leaves [J]. Journal of Plant Physiology, 2003, 160(3): 271-282. doi: 10.1078/0176-1617-00887

    CrossRef Google Scholar

    [38] LIU S, YU H Y, SUI Y Y, et al. Classification of Soybean Frogeye Leaf Spot Disease Using Leaf Hyperspectral Reflectance [J]. PLoS One, 2021, 16(9): e0257008. doi: 10.1371/journal.pone.0257008

    CrossRef Google Scholar

    [39] ZHANG G S, XU T Y, TIAN Y W, et al. Classification of Rice Leaf Blast Severity Using Hyperspectral Imaging [J]. Scientific Reports, 2022, 12: 19757. doi: 10.1038/s41598-022-22074-7

    CrossRef Google Scholar

    [40] ZHOU K, DENG X Q, YAO X, et al. Assessing the Spectral Properties of Sunlit and Shaded Components in Rice Canopies with Near-Ground Imaging Spectroscopy Data [J]. Sensors, 2017, 17(3): 578. doi: 10.3390/s17030578

    CrossRef Google Scholar

    [41] SONOBE R, HIRONO Y, OI A. Non-Destructive Detection of Tea Leaf Chlorophyll Content Using Hyperspectral Reflectance and Machine Learning Algorithms [J]. Plants, 2020, 9(3): 368. doi: 10.3390/plants9030368

    CrossRef Google Scholar

    [42] BARTUCCA M L, GUIDUCCI M, FALCINELLI B, et al. Blue: Red LED Light Proportion Affects Vegetative Parameters, Pigment Content, and Oxidative Status of Einkorn (Triticum Monococcum L. SSP. Monococcum) Wheatgrass [J]. Journal of Agricultural and Food Chemistry, 2020, 68(33): 8757-8763. doi: 10.1021/acs.jafc.0c03851

    CrossRef Google Scholar

    [43] POLA W, SUGAYA S, PHOTCHANACHAI S. Color Development and Phytochemical Changes in Mature Green Chili (Capsicum annuum L. ) Exposed to Red and Blue Light-Emitting Diodes [J]. Journal of Agricultural and Food Chemistry, 2020, 68(1): 59-66. doi: 10.1021/acs.jafc.9b04918

    CrossRef Google Scholar

    [44] WANG Y J, HU X, HOU Z W, et al. Discrimination of Nitrogen Fertilizer Levels of Tea Plant (Camellia Sinensis) Based on Hyperspectral Imaging [J]. Journal of the Science of Food and Agriculture, 2018, 98(12): 4659-4664. doi: 10.1002/jsfa.8996

    CrossRef Google Scholar

    [45] OKYERE F G, CUDJOE D, SADEGHI-TEHRAN P, et al. Modeling the Spatial-Spectral Characteristics of Plants for Nutrient Status Identification Using Hyperspectral Data and Deep Learning Methods [J]. Frontiers in Plant Science, 2023, 14: 1209500. doi: 10.3389/fpls.2023.1209500

    CrossRef Google Scholar

    [46] ZHAI Y F, CUI L J, ZHOU X, et al. Estimation of Nitrogen, Phosphorus, and Potassium Contents in the Leaves of Different Plants Using Laboratory-Based Visible and Near-Infrared Reflectance Spectroscopy: Comparison of Partial Least-Square Regression and Support Vector Machine Regression Methods [J]. International Journal of Remote Sensing, 2013, 34(7): 2502-2518. doi: 10.1080/01431161.2012.746484

    CrossRef Google Scholar

    [47] TAHA M F, MAO H P, WANG Y F, et al. High-Throughput Analysis of Leaf Chlorophyll Content in Aquaponically Grown Lettuce Using Hyperspectral Reflectance and RGB Images [J]. Plants, 2024, 13(3): 392. doi: 10.3390/plants13030392

    CrossRef Google Scholar

    [48] TAN L H, ZHOU L, ZHAO N, et al. Development of a Low-Cost Portable Device for Pixel-Wise Leaf SPAD Estimation and Blade-Level SPAD Distribution Visualization Using Color Sensing [J]. Computers and Electronics in Agriculture, 2021, 190: 106487. doi: 10.1016/j.compag.2021.106487

    CrossRef Google Scholar

    [49] TUERXUN N, ZHENG J H, WANG R J, et al. Hyperspectral Estimation of Chlorophyll Content in Jujube Leaves: Integration of Derivative Processing Techniques and Dimensionality Reduction Algorithms [J]. Frontiers in Plant Science, 2023, 14: 1260772. doi: 10.3389/fpls.2023.1260772

    CrossRef Google Scholar

    [50] KHALESI F, AHMED I, DAPONTE P, et al. The Uncertainty Assessment by the Monte Carlo Analysis of NDVI Measurements Based on Multispectral UAV Imagery [J]. Sensors, 2024, 24(9): 2696. doi: 10.3390/s24092696

    CrossRef Google Scholar

    [51] LU J Q, QIU H B, ZHANG Q, et al. Inversion of Chlorophyll Content under the Stress of Leaf Mite for Jujube Based on Model PSO-ELM Method [J]. Frontiers in Plant Science, 2022, 13: 1009630. doi: 10.3389/fpls.2022.1009630

    CrossRef Google Scholar

    [52] CURRAN P J. Remote Sensing of Foliar Chemistry [J]. Remote Sensing of Environment, 1989, 30(3): 271-278. doi: 10.1016/0034-4257(89)90069-2

    CrossRef Google Scholar

    [53] INOUE Y, GUÉRIF M, BARET F, et al. Simple and Robust Methods for Remote Sensing of Canopy Chlorophyll Content: A Comparative Analysis of Hyperspectral Data for Different Types of Vegetation [J]. Plant, Cell & Environment, 2016, 39(12): 2609-2623.

    Google Scholar

    [54] MARÍN-SAN ROMÁN S, FERNÁNDEZ-NOVALES J, CEBRIÁN-TARANCÓN C, et al. Monitorization of Varietal Aroma Composition Dynamics during Ripening in Intact Vitis Vinifera L. Tempranillo Blanco Berries by Hyperspectral Imaging [J]. Journal of Agricultural and Food Chemistry, 2023, 71(5): 2616-2627. doi: 10.1021/acs.jafc.2c07425

    CrossRef Google Scholar

    [55] LI F L, SHEN J F, YANG Q F, et al. Monitoring Quality Changes in Green Tea during Storage: A Hyperspectral Imaging Method [J]. Food Chemistry: X, 2024, 23: 101538. doi: 10.1016/j.fochx.2024.101538

    CrossRef Google Scholar

    [56] NGUYEN D H D, TAN A J H, LEE R, et al. Monitoring of Plant Diseases Caused by Fusarium Commune and Rhizoctonia Solani in Bok Choy Using Hyperspectral Remote Sensing and Machine Learning [J]. Pest Management Science, 2025, 81(1): 149-159. doi: 10.1002/ps.8414

    CrossRef Google Scholar

  • 加载中
通讯作者: 陈斌, bchen63@163.com
  • 1. 

    沈阳化工大学材料科学与工程学院 沈阳 110142

  1. 本站搜索
  2. 百度学术搜索
  3. 万方数据库搜索
  4. CNKI搜索

Figures(10)  /  Tables(5)

Article Metrics

Article views(508) PDF downloads(106) Cited by(0)

Access History

Classification of Medicinal Mulberry Leaf and Prediction of Chlorophyll Content

    Corresponding author: HE Ningjia

Abstract: 

To advance the construction of a factory-based precision management system for medicinal mulberry, this study first established hyperspectral reflectance-based classification models for leaves under distinct physiological conditions. Subsequently, chlorophyll content prediction models were developed. During the model construction, 3 sample set division methods, 5 data preprocessing methods, and 5 machine learning algorithms were systematically compared. Results of medical mulberry leaf classification indicated that the support vector machine (SVM) models using random database (RD) with either raw data or multiplicative scatter correction (MSC) for sample partitioning-specifically, the RD-RAW-SVM and RD-MSC-SVM-achieved the best R2 values of 0.954 on the test set. Confusion matrix analysis revealed that the classification accuracies for healthy, infested, and shaded leaves were identical across the two different models, yielding 96%, 93%, and 98%, respectively. Nutrient-deficient leaves correctly classified with accuracies of 96% and 97% in the two models. For chlorophyll content prediction, the partial least squares (PLS) model using RD combined with baseline correction (BC)-specifically, RD-BC-PLS-demonstrated optimal performance, with a testing set R2 of 0.895 and root mean square error (RMSE) of 3.461. Additionally, weight analysis identified two critical wavelengths (505 nm and 734 nm) contributing maximally to chlorophyll content prediction, enabling the derivation of novel spectral indices. Comparative evaluation with 19 conventional vegetation indices revealed that the red-edge normalized difference vegetation index (NDVI705) and the newly developed MFD734-505 exhibited equivalent predictive efficacy for chlorophyll estimation, with a testing set R2 of 0.864. This integrated modeling framework provides an important foundation for the precise monitoring and intelligent management of factory-based medicinal mulberry cultivation.

  • 开放科学(资源服务)标识码(OSID):

  • 桑树作为古代丝绸之路的重要基石,数千年来在蚕桑业和传统医药中具有不可替代的地位,《本草纲目》对此早有记载。研究表明,桑树在治疗肥胖[1-2]、高血压[3]和糖尿病[4]等方面具有重要的药理活性。其中最突出的是药桑(Morus nigra L.)。该品种原产伊朗,广泛种植于中国新疆地区,具有特殊遗传结构(22倍体,2n=308)和丰富的次生代谢产物[5-6]。当前,药桑以无性繁殖为主,新疆地区主要采用嫁接育苗,然而该方法存在成活率低、出圃率低、建园缓慢的缺陷[7]。此外,药桑可通过组织培养快速获得大量幼苗,但组培苗在户外栽培易受病虫侵害[8],且环境因素会显著影响次生代谢物积累[9]。因此,创新药桑栽培模式,实现标准化精准化生产至关重要。

    植物工厂通过精准的环境调控可实现周年生产,提升生物量[10],此外,该技术能加速种苗繁育、缩短生产周期并保障苗木质量的一致性,为规模化种植和产业化发展提供支撑[11]。植物工厂目前已经用于多种高价值药用植物[12-13],如蛇根草(Ophiorrhiza pumila)的快速繁育与植物化学物质均一化生产[14]。该方法为药桑产业化提供了坚实的技术支撑。然而,要实现高效的规模化生产,仍需引入智能化的精准监测系统作为支撑。

    高光谱技术通过多波段反射光谱捕捉植物精细特征[15]。现代农业系统正广泛集成高光谱传感器,用于胁迫表型分类[16-17]和化合物含量分析[18-19]。此外,高光谱数据可开发波段筛选模型,创建具有更强预测能力的新指数[20],这些指数在现代农事管理中对各类农业指标的预测至关重要[21]。随着计算机领域的发展,基于机器学习的预测模型能够精准捕捉叶绿素动态对虫害胁迫、遮光胁迫及营养缺失胁迫的敏感性响应特征[22-23],从而为作物健康状态的动态监测提供关键依据。

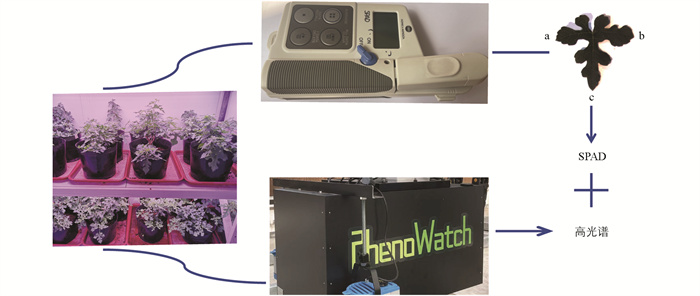
    本研究聚焦于药桑组培苗的室内工厂化生产场景,通过施加不同处理方式,采集高光谱反射率数据。首先,运用5种预处理方法,基于极限学习机(Extreme Learning Machine,ELM)、支持向量机(Support Vector Machine,SVM)、K近邻(K-Nearest Neighbors,KNN)、偏最小二乘(Partial Least Squares,PLS)和随机森林(Random Forest,RF)这5种算法,开发叶片不同生理状态的分类模型。针对叶绿素含量的预测,采用ELM、多元线性回归(Multiple Linear Regression,MLR)、支持向量回归(Support Vector Regression,SVR)、PLS和RF方法构建回归模型,进一步从高光谱数据中筛选出特征波段,构建新的植被指数,并与传统植被指数在叶绿素含量预测性能方面进行比较分析。通过分类模型与回归模型的联合运用,能够同步检测药桑组培苗的胁迫状态(如虫害、遮光、营养)和生理状态(如叶绿素含量水平),从而为药桑的产业化栽培管理提供坚实的数据支撑。

1.   材料和方法
  • 药桑植株在西南大学国家桑树品种改良中心(重庆分中心)的室内环境中培育。生长参数设定为25±3 ℃、50%相对湿度及16 h光照/8 h黑暗循环,光源为LED。药桑栽培于28 cm×25 cm盆中,基质为营养土、珍珠岩与蛭石混合(体积比16∶1∶1)。每组处理持续4周,每周浇水1次,每两周施用平衡型水溶肥,施肥方案参照厂商说明。自然虫害以白粉虱侵染为主;遮光处理采用90%以上遮光率,其他条件不变;营养缺陷组仅浇水不施肥。

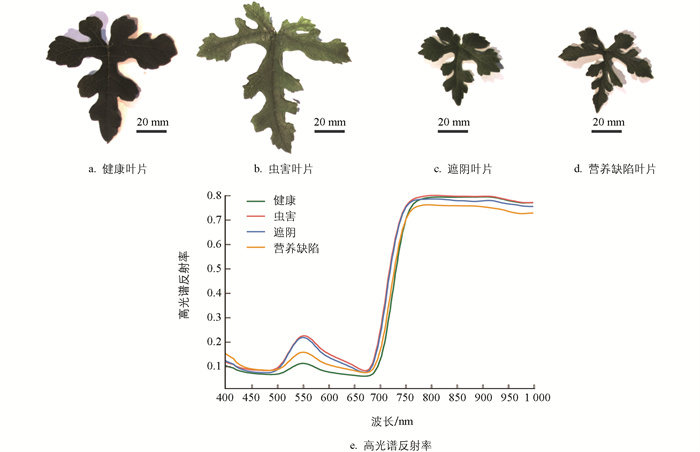
  • 针对不同处理组的药桑叶片,随机选取完全展开的叶片,使用SPAD-502叶绿素仪进行无损检测[24]。在叶片尖端预设a、b、c 3个位点作为感兴趣区域(ROI,图 1),每个点位重复测量3次,取均值作为该点的SPAD值。剔除测量误差导致的异常值后,最终获得1 238组数据,其中健康叶525组、虫害叶431组、遮光叶228组和营养缺陷叶54组。

  • 通过轨道式高通量植物表型平台(PhenoWatch,泽泉科技,上海)采集上述测定了叶绿素含量的叶片的RGB和高光谱成像数据。轨道式高通量表型平台集成Dualix高光谱模块(双利合谱,江苏)和RGB模块(MV-CS200-10GC,海康,浙江),RGB模块的分辨率为2000万像素。高光谱成像系统配备Image-λ-V10-HR光谱仪、HSIA-OL23镜头、双HSIA-LS-T-600W光源,可采集400~1 000 nm波段区间的176反射光谱。高光谱数据通过SpectraVIEW(v2.9.2.33)软件进行黑白校正和平滑处理,在HyperScan软件中选取SPAD仪检测的ROI点位反射光谱用于后续分析。

    本研究采用Savitzky-Golay平滑(Savitzky-Golay Smoothing,SG)、最小-最大归一化(Min-Max Normalization,MMN)、标准正态变量变换(Standard Normal Variate,SNV)、多元散射校正(Multiplicative Scatter Correction,MSC)和基线校正(Baseline Correction,BC)预处理高光谱数据,以降低基线漂移影响。此外,采用Kennard-Stone (KS)、基于联合X-Y距离的样本集划分(Sample Set Partitioning Based on Joint X-Y Distances,SPXY)和随机数据集(Random Database,RD),按3∶1比例划分训练集与测试集,确保光谱代表性。分类模型中,为了消除样本量不平衡,采用高斯噪声对最小样本营养缺陷叶数据进行增强,每个样本生成3个增强样本。

  • 基于Python的Scikit-learn库开发机器学习模型,重点构建药桑叶片4分类(健康、虫害、遮光和营养缺陷)模型及不同处理下叶绿素含量回归模型。针对400~1 000 nm的176个波段,系统整合5种预处理方法(MMN、SG、MSC、SNV和BC)与5种算法优化分类预测与叶绿素回归模型。为验证稳健性,各算法迭代100次,采用100次决定系数(Coefficient of Determination,R2)和均方根误差(Root Mean Square Error,RMSE)的平均值评估模型性能,混淆矩阵采用100次不同分类预测概率的平均值进行展示。如图 2所示,以全波段光谱反射率为输入,系统应用预处理策略与算法组合建立物质特异性高光谱分析框架。通过网格搜索与10折交叉验证从预设参数空间确定最优超参数。

  • 研究者采用光谱反射率一阶导数估算叶绿素[25]。本研究通过光谱特征分析确定两个关键波段组合:第一组基于光谱相关性分析确定的吸收谷(551 nm与709 nm),第二组为叶绿素预测模型中权重最大的最优波段(505 nm与734 nm)。利用每组波段的一阶导数反射率,通过差值、比值和归一化等方法构建新指数(表 1)。为评估新指数性能,系统性比较了19种文献报道的指数(数学公式与参考文献见表 2)。

  • 采用SPSS 19进行统计分析与相关性研究,Duncan检验比较均值(显著性阈值p≤0.05),组间差异通过单因素方差分析(ANOVA)评估。Python 3.12用于模型构建、线性回归及大数据折线图生成。

2.   结果与分析
  • 图 3展示了不同处理条件下药桑叶的高光谱变化。所有光谱曲线在550 nm和740 nm处均呈现出明显的吸收特征。在450 nm(蓝光区域)和650 nm(红光区域)之间出现一个显著的反射峰,该反射峰位于550 nm(绿光区域)。在可见光光谱(500~750 nm)范围内,与健康叶片相比,受虫害叶片、遮阴叶片和营养缺陷叶片的反射率显著降低。所有的光谱在近红外范围(700~900 nm)内发生明显的变化。在近红外光谱(750~1 000 nm)范围内,营养缺陷叶片的近红外反射率明显较低,而受虫害叶片、遮阴叶片与健康叶片的反射率差异不显著。

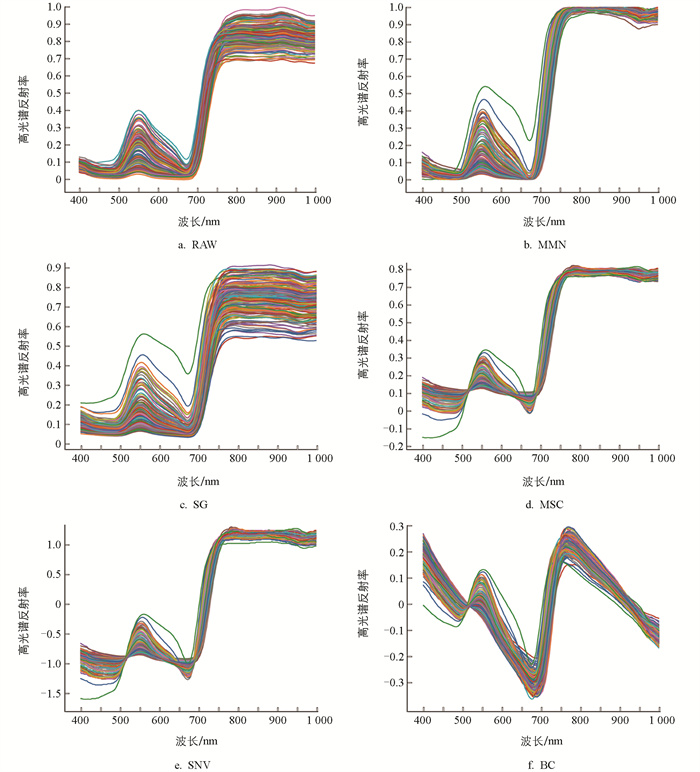
  • 为了提高检测模型的预测准确性和稳定性,系统地应用了5种预处理策略(图 4)。原始光谱(RAW)是通过SpectraVIEW光谱分析软件从药桑叶的高光谱图像中提取的未经处理的吸收数据。与原始光谱相比,MMN和SG预处理在可见光范围(400~700 nm)内表现出更强的振幅变化。在近红外区域(750~1 000 nm),MMN处理导致光谱收缩,而SG处理则产生了更大的振幅变化。经过MSC和SNV预处理后,光谱范围在500~1 000 nm区域内显著收缩,有效减轻了散射引起的光谱变化,同时纠正了光谱数据中的基线漂移和偏移。MMN、MSC、SNV和BC预处理均有效地增强了750 nm以上区域的光谱收敛性,产生了重叠的光谱轨迹,变异性降低。相反,SG处理放大了750~1 000 nm关键波段内的信号分辨率。

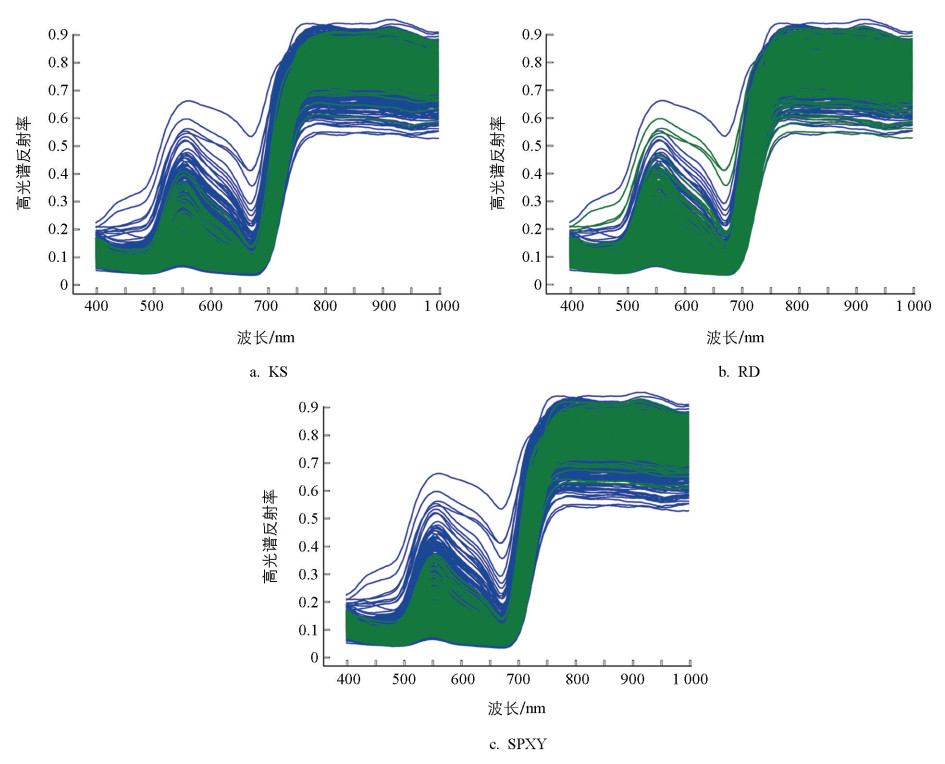
    样本划分对模型的稳健性影响较大。如图 5所示,KS和SPXY优先选择了550 nm处反射率更低且750~1 000 nm区间内反射率高的样本,而RD的选择则相对均匀。采用这3种不同的样本划分方法构建了对比模型,结果显示,采用RD方法建立的模型,在R2RMSE两项指标上均优于KS和SPXY方法,因此选择RD方法进行后续分析。为了减轻大规模数据集(n=1 239)中的随机抽样误差,进行100次迭代取平均值。

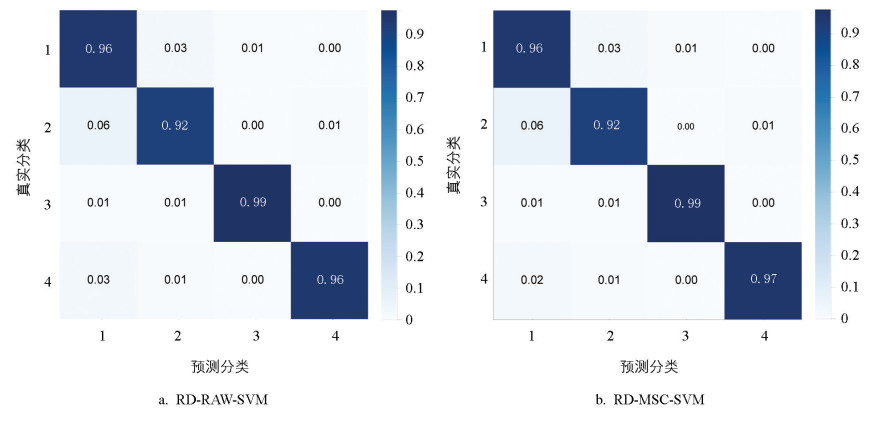
  • 分类模型在不同预处理方法和算法下的性能差异显著(表 3)。与原始数据相比,在KNN和RF算法下,预处理方法均显著提升了测试集的R2值。MSC预处理显著提升了ELM算法测试集的准确率。然而,ELM、SVM和PLS模型在使用数据预处理后出现R2显著降低,表明在这些预处理后,光谱特征发生了退化。此外,KNN、PLS和RF算法中训练集和测试集之间的差异较大,出现了明显的算法过拟合现象。值得注意的是,相较于其他算法组合,SVM算法无论是在原始数据还是在MSC光谱预处理条件下均表现出更优的预测准确性。具体而言,RD-RAW-SVM与RD-MSC-SVM模型展现出更强的稳健性,其在训练集上的R2值分别为0.975±0.008和0.976±0.008,在对应测试集上的R2值则分别为0.954±0.011和0.954±0.009。混淆矩阵分析结果(图 6)显示,RD-RAW-SVM和RD-MSC-SVM模型对420个测试集样本(健康:158个;虫害:129个;遮阴:69个;营养缺陷:64个)的4种叶片状况进行了预测,健康叶片(96%)、受虫害叶片(92%)、遮阴叶片(99%)和营养缺陷样本(96%和97%)的预测准确率均较高。

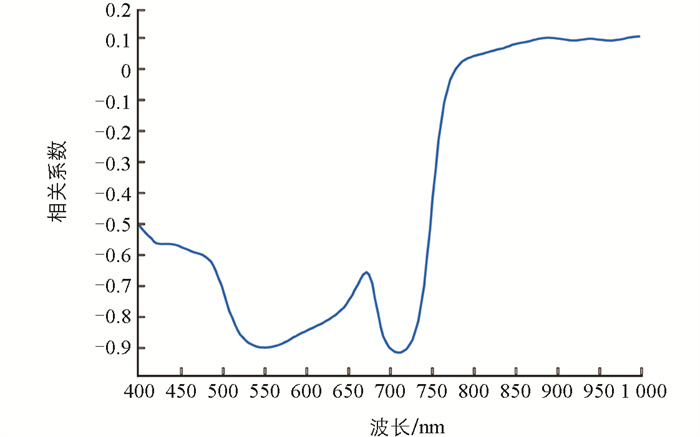
  • 图 7展示了176个波段(400~1 000 nm)与叶绿素相对含量(SPAD值)之间的相关性。光谱反射率与叶绿素含量在400~780 nm区间内呈负相关,而在780~1 000 nm区域内为正相关。具有显著相关性(|r|>0.4,p≤0.05)的波段主要集中在400~750 nm之间。光谱轮廓显示两个明显的低谷,其中最小值分别位于551 nm和709 nm。
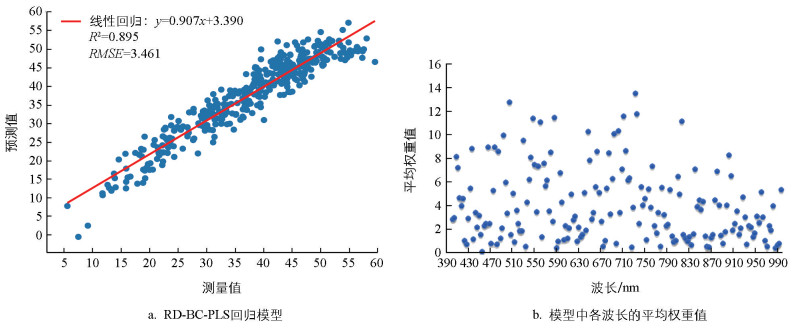
    表 4所示,除了MLR和PLF算法,其他算法在预处理后均不同程度地提升了测试集的R2。RD-SNV-RF模型在训练集(R2=0.977)和测试集(R2=0.902)之间的性能存在显著差异,这表明可能存在过拟合风险。因此,模型优化优先考虑训练集和测试集的平衡性和最大的测试性能。综合评估,RD-BC-PLS模型在训练集和测试集上的R2值相当,分别为0.898±0.004和0.895±0.008,相比之下,该模型具有较高的预测性能,因此,选择RD-BC-PLS为最优模型。图 8a展示了测试集的线性回归方程为y=0.91x+3.39。对建模过程中各波长的平均权重值进行分析(图 8b),结果显示505 nm和734 nm两个波段的平均权重值大于12,为预测的关键光谱波段。

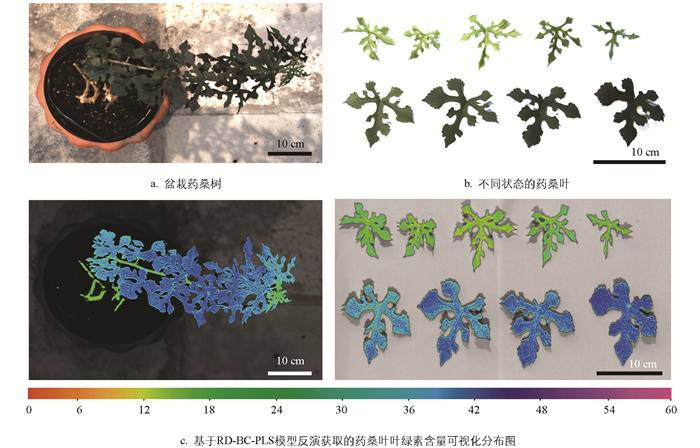
    随后,采用RD-BC-PLS模型对药桑完整植株(图 9a)和离体叶片(图 9b)的叶绿素含量进行像素级量化,从而生成高分辨率的叶绿素分布图。整株药桑中,顶端叶片及枝条的叶绿素含量较低。随着叶片成熟度增加,叶绿素含量逐渐增加;随着叶片逐渐衰老,叶片叶绿素含量逐渐降低。离体叶片(图 9c)中,同一张叶片的不同像素点的叶绿素含量同样存在差异。该方法成功捕捉了不同叶片材料和整个植株系统中叶绿素的动态响应模式,从而建立了一种用于空间叶绿素含量评估的可视化无损方法。

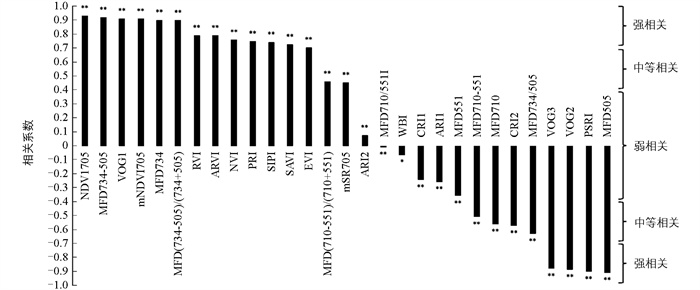
  • 从关键吸收特征(551 nm和709 nm)和叶绿素含量预测模型中权重最高的两个波段(505 nm和734 nm)的光谱反射率中提取一阶微分值。通过微分、比率和归一化运算,开发了10个用于药桑叶绿素估算的光谱指数(表 1)。通过与SPAD测量值的皮尔逊相关性分析,将新植被指数与19个已建立的植被指数进行了比较。如图 10所示,有17个强相关(|r|>0.7),6个中等相关(0.4≤|r|≤0.7),6个弱相关(|r|<0.4),其中,7个指数表现出极强的相关性(|r|>0.9),包括NDVI705(0.930)、MFD734-505(0.920)、VOG1(0.911)、mNDVI705(0.909)、MFD734(0.901)、PSRI(-0.902)和MFD505(-0.910)。随后选取了3个相关系数最高的植被指数(表 5),采用PLS算法进行模型预测,结果显示,NDVI705和MFD734-505的预测能力相当,其R2分别为0.864±0.012和0.864±0.011,显著优于VOG1。

3.   讨论与结论
  • 药桑叶的高光谱特征分析为室内栽培条件下光谱与生理间的关系提供了重要信息。首先,在可见光光谱(400~750 nm)范围内,观察到了健康植被典型的3峰反射模式,其吸收谷分别位于450 nm(蓝光)和650 nm(红光),两者间是550 nm处的绿色反射峰(图 3)。这一模式可作为评估叶绿素活性的可靠基线[37]。然而,受胁迫的叶片呈现出差异特征,与健康对照相比,在500~750 nm范围内的光谱反射率增加,但不同胁迫类型呈现出不同的特征模式。在500~750 nm范围内,受虫害叶片光谱反射率高于健康叶片光谱反射率,这一发现与已有文献报道的研究结果一致[38-39]。田间研究报告在遮阴条件下,与正常生长的叶片相比,在500~750 nm区间植物叶片的光谱反射率会降低[40-41],但本研究在室内栽培条件下,光谱反射率出现相反的模式,表明自然遮阴和可控光照环境之间存在显著的生理差异。造成这一差异可能的原因是,本研究中使用的人工照明系统添加了红光(600~700 nm)和蓝光(400~500 nm)光谱带,研究表明,这些波段与叶绿素生物合成和养分吸收有关[42-43]。此外,研究表明,在500~750 nm范围内,光谱反射率与叶片养分含量之间呈反比关系[44-45],这一结果与本研究结果相符,进一步证实了光谱反射率模式与植物生理状态之间的直接相关性。在近红外过渡区(750~1 000 nm),叶片呈现出预期的反射率快速增加随后趋于平稳的现象[44],而营养缺陷样本与其他胁迫组相比,近红外反射率显著降低。由于近红外反射率主要取决于叶片内部结构[46],这表明养分缺乏比生物胁迫或光照限制引起的超微结构变化更为显著。本研究为室内药桑生产中的早期营养缺陷检测提供了潜在的光谱标记。

  • 本研究基于RAW或MSC预处理,采用SVM算法构建的模型,在健康、虫害、遮阴和营养缺陷叶片的分类准确率超过92%,展示了较高的预测性能。原始数据中,营养缺陷叶片采集较少,为了消除模型评估指标失真和评估偏移,采用高斯噪声的方法进行3倍数据增强,与未增强时的预测性能相比,极大提升了营养缺陷叶片的预测性能(数据未展示,提升了10%)。

    现有研究中,通过计算机算法预测叶绿素含量的数据来源主要包括RGB图像和高光谱反射率等。玉米中的研究表明,在温室条件下,基于RGB图像特征的模型对叶绿素含量的预测R2为0.67~0.88 [47]。在可控光照条件下,基于RGB颜色特征的像素级叶绿素含量的预测R2可达到0.97 [48]。本研究采用高光谱反射率数据对药桑叶片叶绿素含量进行预测,预测性能与相关研究对多年生作物的预测性能相当,如枣树的R2为0.89[49]

    植被指数,尤其是红边归一化植被指数(NDVI),是评估植物生理动态的基本诊断工具[50]。NDVI705与枣树[51]和生菜[47]的叶绿素含量显示出更优的相关性,这与我们的实验结果相符。值得注意的是,我们通过模型构建筛选出的波长建立的指数MFD734-505,展现出与NDVI705相当的预测能力。MFD734-505通过734 nm和505 nm的一阶导数差值构建,505 nm波段位于叶绿素b的最大吸收峰(450~500 nm)附近,通过其对色素浓度和栅栏组织结构的双重响应,可作为早期胁迫检测的敏感生物传感器[30, 37],734 nm波长位于叶绿素敏感的红边过渡区(700~750 nm),其导数反映叶绿素含量变化引起的红边位移,该区域的反射率梯度与由叶肉结构介导的叶绿体分布模式相关[52-53]。734 nm和505 nm的一阶导数差值可用于增强叶绿素信号并抑制背景干扰,从而更灵敏地捕捉叶绿素动态。本研究中,该指数能够有效应用于处于不同胁迫条件下且叶绿素含量差异显著的药桑样本的叶绿素含量预测。在后续研究中,可探索不同的光谱特征和先进算法,以进一步提高模型在不同生长条件和品种中的泛化能力。

  • 本研究基于高光谱成像技术开发了药桑叶分类模型和叶绿素含量预测模型,借助该模型,可实现对药桑生理状态的实时、无损评估,包括早期检测生物和非生物胁迫、优化施肥和灌溉方案,以及通过叶绿素定量进行持续质量监测。这一方案可为现代精准农业提供关键数据支持,直接有助于改善作物管理实践和产量优化[37]。本研究建立的方法学框架具有跨领域应用潜力,可进一步拓展至多个领域,如植物或其他样品的活性成分快速无损检测[54-55],以及病虫害侵染早期特征的光谱识别[56]等领域。

    为了更好地服务于精准农业实践,未来还需要对该方案不断进行完善。首先,在数据层面,应系统性地扩充训练数据集,纳入更广泛的环境变异(如不同气候带、土壤类型)和连续胁迫梯度(如水分/养分亏缺程度),从而显著提升模型的泛化能力和实际适用性。其次,在硬件集成方面,需与新一代微型化、低成本的光谱传感设备相结合,特别是开发适合田间大规模部署的便携式系统,这将直接决定技术推广的可行性。例如,基于上述药桑叶片的高光谱反射率与机器学习算法的多模型体系,为实现工程化应用,后期可采用低成本多光谱传感器或便携式光谱仪替代高光谱设备,通过嵌入式系统,通过轻量化模型部署实现实时监测,具体部署逻辑为:传感器采集→边缘计算(剔除异常值)→模型推理→结果无线传输至云平台进行可视化。此外,在技术创新层面,后续工作应重点突破算法瓶颈,通过融合深度学习和物理机理的混合建模策略来优化预测性能。这些技术突破将最终融入智慧农业,为药桑产业的提质增效和可持续发展提供科技支撑。

  • 本研究构建了一个药桑精准栽培的工业化繁育框架,将高光谱反射率分析技术与机器学习架构相结合。开发出了不同生理状态药桑叶片的分类模型,其对健康、虫害、遮阴和营养缺陷叶片的诊断准确率均超过90%。此外,构建了不同生理状态药桑的叶绿素回归模型,该模型预测性能良好(测试集R2为0.895,RMSE为3.461)。光谱敏感性分析确定了两个对叶绿素动态变化起关键诊断作用的关键波长(505 nm和734 nm),构建了新型的MFD734-505植被指数。在叶绿素定量方面,该植被指数的预测性能与NDVI705具有等效性(p≤0.05)。本研究将高光谱传感技术与机器学习相结合,开发药桑叶分类模型和叶绿素含量回归模型,为药桑栽培的智能化管理提供了重要数据。

Figure (10)  Table (5) Reference (56)

Catalog

    /

    DownLoad:  Full-Size Img  PowerPoint
    Return
    Return