全文HTML
-
改革开放40年来我国城镇化程度大幅提升,从1978年的17.9%上升到2017年的58.5%,城镇人口从1978年的1.7亿人增长至2017年的8亿多人①,年均增长1 600多万人。城镇化已成为经济增长的重要引擎,为居民生活提供了越来越丰富的物质文化成果。然而,我国城镇化在取得巨大成就的同时,在追求城镇化速度与规模过程中也出现了较为明显的重数量、轻质量的倾向,城乡贫富差距扩大,人口、交通日益拥挤,就业、住房、生态环境压力加剧等问题日益突出。城镇化质量的问题在党的十九大报告、2012年的中央经济工作会议、《国家新型城镇化规划(2014-2020年)》《中共中央关于全面深化改革若干重大问题的决定》、中央城镇化工作会议中被频繁提及,2016年2月出台的《国务院关于深入推进新型城镇化建设的若干意见》进一步提出要加强提升城镇化质量,推动经济社会协调发展。
① 数据来源于《中国统计年鉴2018》。
当前,国外对城镇化质量的直接研究较少,但是相关研究非常丰富,主要围绕卫星城市、生态城市、绿色城市、可持续城市、城市居民生活质量等开展研究[1-3],联合国人居中心关于城镇发展指数(CDI)与城镇指标准则(UIG)在城镇化质量综合测度方面的研究具有一定的代表性[4-5]。国内主要从城镇化质量内涵、测度、区域差异、动力因素以及与城镇化规模或者其他要素的协调性等方面研究[6-8],但仍未形成统一的城镇化质量内涵及评价体系。
作为我国西部唯一的直辖市,重庆市是长江上游地区的经济中心和统筹城乡综合改革配套试验区,大城市、大农村、大库区、大山区并存,具有典型的城乡二元结构特征。但自直辖以来,重庆经济得到迅速发展,城镇化率也从直辖之初的31.0%提高到了2017年的64.1%。为了考察城镇化发展质量,探讨其动力因素,本文在对城镇化质量内涵深入理解的基础上,构建城镇化质量综合测度体系,以重庆市这一典型地区为例,利用重庆市辖各区县的面板数据,对直辖以来重庆市城镇化质量及其空间格局演变和动力因素进行研究,以期总结规律,查找问题,为重庆市及其他地区提升城镇化质量提供借鉴。
-
① 相关数据来源于《中国统计年鉴2018》《重庆统计年鉴2018》。
-
新中国成立以来到改革开放前的这段时期(1949-1978年),在国家传统计划经济的指导下,除阶段性受宏观政治经济计划波动的影响及自身区位条件的限制出现停滞倒退外,地区经济和工业水平整体得以恢复与提升。地区生产总值由1949年的13.89亿元增加到1978年的71.70亿元。工业也得到了恢复与发展,工业总产值由1949年的2.5亿元增至1978年的31.35亿元,工业总产值占地区总产值的比重也由18%提升到了44%。重庆市地区总产值构成中的一、二、三产业的比例由1949年的70.1:19.5:10.4调整为1978年的34.6:48.1:17.3,第二、三产业比重不断上升。
由于常住人口与城镇人口的统计起步较晚,《重庆统计年鉴》于1996年才开始有规范的统计。最早的人口统计数据是1957年开始的,包括户籍人口与非农业人口等。为了系统反映重庆市城镇化的发展情况,以户籍人口、非农业人口、非农业人口比重来观察重庆市城镇化进程。1978年末,重庆市户籍人口2 635.56万人,其中非农业人口330.90万人,相较于有统计数据以来的1957年,非农人口仅增加了18.49万人,非农业人口比重下降了3.02%。虽然重庆市在新中国成立后到改革开放前的这段时期内,地区经济和工业水平得以恢复与提升,但是从人口城镇化角度来看,城镇化进程却出现一定程度倒退。
-
改革开放后至重庆市直辖前的这段时期(1979-1996年),传统计划经济逐渐退出历史舞台,改革开放力度不断加大,市场经济不断发展,重庆市积极响应,地区经济和工业水平发展迅速,城镇化进程得以快速推进。地区生产总值由1979年80.68亿元增加了16.3倍,达到1996年的1 315.12亿元。工业水平得到迅速提升,工业总产值由1978年的35.00亿元增加了14.3倍,达到1996年的502.06亿元。重庆市地区总产值构成中的一、二、三产业的比例由1979年的35.6:47.2:17.2调整为1996年的21.9:43.4:34.8,第二产业比重略有下降,第三产业比重提升两倍。
1996年末,重庆市户籍人口3 022.77万人,其中非农业人口577.12万人,相较于有统计数据的1978年末,非农人口仅增加了246.22万人,非农业人口比重虽提升了6.5%,但重庆市城镇化率(29.5%),仍低于同期全国城镇化率(30.48%)。重庆市在改革开放后至直辖前时期内,虽然地区经济和工业水平迅速提升,城镇化进程得以稳步推进,但重庆市城镇化进程仍慢于我国平均水平。
-
1997年,重庆市成为中国继北京、天津、上海之后的第四个直辖市,直辖面积达到8.24万平方公里,承载人口近三千万。直辖赋予了重庆市新的经济和政治资源,成为重庆经济和社会发展的重要转折点,为重庆的城镇化道路奠定了经济和社会基础,重庆市城镇化进程步入了快速发展期。重庆市地区生产总值由1997年的1 509.75亿元增加到2017年的19 500.27亿元,近直辖时的13倍。工业化发展水平进一步提升,工业总产值由1997年的567.88亿元增长了近10倍,达到2017年的6 587.08亿元,工业总产值占地区总产值的比重稳定在33%~40%之间。重庆市地区总产值构成中的第一、二、三产业产值的比例由1997年的20.3:43.1:36.6调整为2017年的6.9:44.1:49,第三产业比重不断上升,成为重庆市经济发展的重要支撑。
直辖以后,随着工业化水平的提升,重庆市第一产业比重不断下降,第二、三产业的比重大幅提升,农村人口逐渐向城镇转移,城镇人口大量增加,城镇化率显著提高。重庆市常住人口中的城镇人口由1997年的848.21万人增加到2017年的1 970.68万人,增加了1 100多万人。重庆市城镇化率由1997年的29.5%,于2008年首次达到50%,并继续提高到2017年的64.1%,实现了直辖后城镇化率的翻倍,超过了全国平均水平。
-
重庆市作为西部地区唯一的直辖市,自直辖以来,随着社会经济的不断发展、工业化水平不断提高,城镇化率持续增长。2002年重庆市城镇化率达到39.9%,首次超过全国平均水平39.09%,随后一直领先全国,2017年高于同年全国平均水平的58.52%。重庆市城镇化速度快于全国平均水平,1997年至2015年期间,重庆市城镇化率年平均增幅为1.67%,除2000年、2010年、2015年外,重庆市城镇化率同比增幅均超过全国平均水平。
在“十一五”期间,重庆市城镇化率由2005年的45.2%增加到2010年的53.02%,城镇化率的全国排名保持在第12名;在“十二五”期间,重庆市的城镇化率增加到2015年的60.94%,全国排名提升到第9名。在西部地区,重庆市城镇化率位列前茅,2013年之前城镇化率低于内蒙古,2015年重庆市反超内蒙古0.64%,位列西部第一。但与其他直辖市及东部沿海地区相比,重庆市的城镇化水平还有较大差距①。
① 数据来源于《中国统计年鉴2006》《中国统计年鉴2011》《中国统计年鉴2016》。
-
作为我国四个直辖市之一,重庆市虽拥有直辖市的体制,但市辖区域却相当于一个中等省域的框架。从辖区面积来看,北京、天津和上海的面积仅为重庆市的1/14~1/5。同时,重庆市的人口和空间经济特征与其他三个直辖市也存在较大差异,具有较为明显的“大城市、大农村”的二元城镇化特征,市域范围内不同区县发展水平也存在较大差距。
由于重庆市直辖后,《重庆统计年鉴》中对于各区县的城镇化的统计最早始于2003年,因此为保证数据的连续性和可比性,本文采用2003年及2015年的重庆市各区县的城镇化率进行比较分析。2003年城镇化最高的是渝中区、大渡口区、江北区、沙坪坝区、九龙坡区、南岸区,城镇化率均达到100%,城镇化率最低的是彭水县,仅有12%,两者相差88%;2015年城镇化率最高的是渝中区100%,最低的是酉阳县30.91%,两者相差60.09%。可见,各区县城镇化进程的差距呈缩小趋势。
从重庆市各区县城镇化率的排名情况及分布区域来看,2003年及2015年城镇化率排名在前五名的区县为渝中区、大渡口区、江北区、沙坪坝区、南岸区,集中于重庆市主城区域;2003年及2015年城镇化率排名后五位的有彭水县、巫溪县、酉阳县、秀山县、城口县和巫山县,集中分布在渝东南和渝东北地区。可以发现,重庆城镇化进程呈现出较为明显的区域性差异。
一. 重庆市城镇化发展历程①
1. 改革开放前重庆市的城镇化进程(1949-1978年)
2. 改革开放后至直辖前的城镇化进程(1979-1996年)
3. 重庆市直辖后的城镇化进程(1997-2017年)
二. 重庆市城镇化发展比较分析
1. 重庆市城镇化发展与国内地区比较分析
2. 重庆市辖各区县城镇化发展比较分析
-
城镇化质量是相对于城镇化数量而言的,然而并不是城镇化数量之外的所有因素都属于城镇化质量的内容。综合不同学者对城镇化质量的理解,本文认为城镇化质量,是指在城镇化进程中由经济、社会、生态环境、城镇化效率和城乡协调程度五个方面的发展质量,系统反映城镇化优劣程度的一个综合概念。因此在对城镇化质量内涵理解及界定的基础上,借鉴相关研究[9-12],结合重庆市的实际情况,遵循科学性、系统性、代表性、可比性及可操作性的原则,从经济发展质量、社会发展质量、生态环境质量、城镇化效率及城乡协调程度五个方面,建立了重庆市城镇化质量综合测度指标体系,共选取了13个具体指标,包括正向指标和逆向指标(见表 1)。
-
基于重庆市城镇化质量测评指标数据的可获取性,为了科学、客观、规范、全面地测度重庆市城镇化质量,本文采用2007-2015年重庆市及重庆市辖各区县的面板数据作为研究数据。数据来源于《中国统计年鉴》《中国环境统计年鉴》《重庆统计年鉴》《重庆经济年鉴》《重庆市环境状况公报》《重庆水资源公报》及重庆市辖各区县统计公报。
一. 测度指标体系构建
二. 数据来源
-
综合指标体系的测度方法主要有两种:主观赋权法和客观赋权法。为保证对重庆市城镇化质量客观的测度,避免人为主观因素的干扰,本文采用客观赋权法中的熵值法[13]对重庆市城镇化质量进行测度分析。通过熵值法计算得到的2007年、2011年和2015年重庆市辖区县城镇化质量测度指标的权重值,如表 2。根据熵值法计算出来的权重,计算得出2007年、2011年和2015年重庆市辖各区县城镇化质量的综合得分,如表 3所示。
-
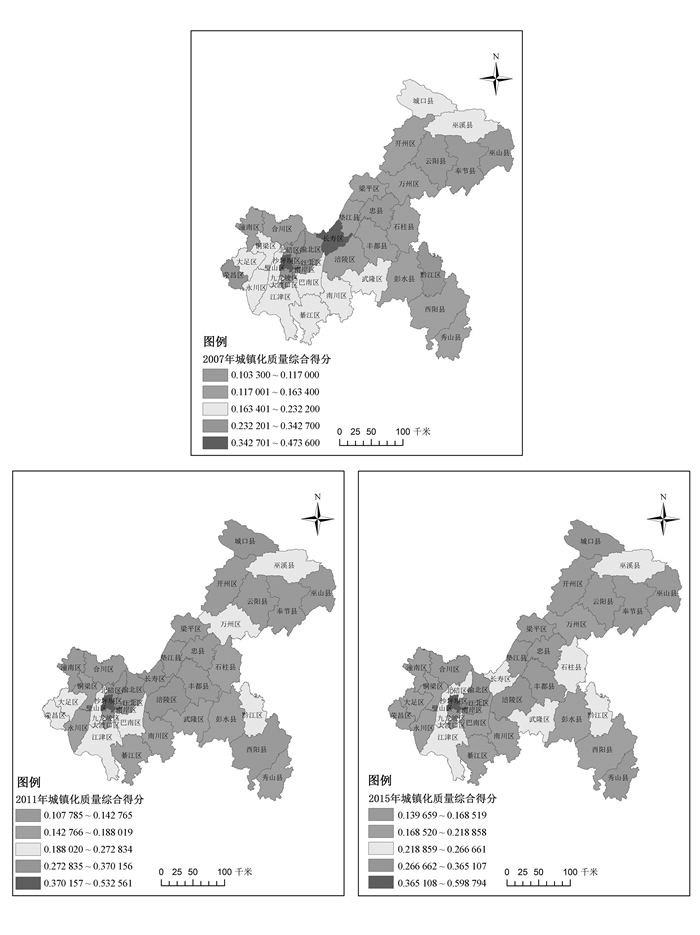
利用ArcGIS 10.2软件,采用自然断裂法(Natural Breaks Jenks)将2007年、2011年和2015年重庆市辖各区县城镇化质量得分划分为5个等级,分别为城镇化质量高等级、城镇化质量较高等级、城镇化质量中等级、城镇化质量较低等级和城镇化质量低等级,绘制出空间格局分布图(图 1),并将5个等级区域的城镇化质量均值及包含区县个数划分情况整理如表 4所示。
从2007年、2011年和2015年重庆市辖各区县城镇化质量综合得分空间格局(图 1)及各等级划分情况(表 4)中可以看出:2007-2015年重庆市城镇化质量高等级区域所含区县数量有所下降,空间上主要分布在渝中区和沙坪坝区;2007-2015年重庆市城镇化质量较高等级区域所含区县数量减少,空间上主要分布在主城区域;2007-2015年重庆市城镇化质量中等级区域所含区县数量在增加,空间上由临近主城区域向渝东南和渝东北转移;2007-2015年重庆市城镇化质量较低等级区域所含区县数量在降低,空间上由渝东南地区逐渐向临近主城区域和渝东北地区转移;2007-2015年重庆市城镇化质量低等级区域所含区县数量在增加,空间上由渝东南地区向临近主城区域和渝东北地区扩张。
总体上看,2007-2015年重庆市城镇化质量各等级区域的均值均在增加,说明重庆市辖区县城镇化质量整体提升;重庆市城镇化质量高等级和低等级区域包含区县数量占全部区县的比例由2007年的17.5%增加到2015年的31.58%,说明重庆市城镇化质量逐渐呈现两极分化现象;空间格局总体呈现出以重庆市主城各区,向临近主城区域,再向渝东南和渝东北地区逐级降低的空间格局特征。
一. 重庆市城镇化质量测度
二. 重庆市城镇化质量空间格局演变
-
城镇化质量是城镇化进程由“量”到“质”的提升,对城镇化质量动力因素的研究是理解城镇化质量提升机制的前提和基础。因此,本文借鉴欧向军、甄峰等和陈明星、陆大道等的四维分析视角[14-15],将重庆市城镇化质量的动力因素归纳为行政动力、内源动力、外源动力、市场动力四个方面进行实证检验。本文选取的重庆市城镇化质量动力因素分析模型的变量和指标,如表 5所示。
行政动力主要指政府资源投入对城镇化质量提升产生的推动作用。政府拥有社会经济发展的重要资源,而国家和各级政府的政策实施又兼具了一种特殊的先发性,政府作为主导力量的直接投入,对区域城镇化质量的提升影响重大。政府通过财政支出对农林业、教育科研、医疗卫生、交通运输、社会保障等项目的资源投入,提升了社会公共服务的质量,增强了区域的吸引力。因此,本文选用财政支出(元)代表行政动力,同时为保证数据的平稳性,将财政支出(元)取自然对数后作为解释变量(LnGOV)。
内源动力主要指产业结构的优化调整对城镇化质量提升产生的推动作用。城镇与农村的主要区别就是产业结构,城镇化是工业经济取代农业经济,工业社会取代农业社会的过程。产业结构向着工业、建筑业和服务业方向变化是城镇化发展的内在动力。因此,本文选用非农产业比重(%)代表内源动力作为解释变量(INNER)。
外源动力主要指外贸外资的发展对城镇化质量提升产生的推动作用。自经济全球化和我国对外开放政策实施以来,重庆市积极响应并稳步打造内陆开放高地,重庆市进出口总额从2007年的744 546万美元增加到2015年的7 447 656万美元,增长近10倍。进出口贸易的提升既带动了地区经济的增长、技术和管理水平的提高,也使得产业和就业结构向非农产业的转化升级,促进了城镇化质量的提升。因此,本文选用进出口总额占地区生产总值比重(%)代表外源动力作为解释变量(EXTER)。
市场动力主要指经济市场化对城镇化质量提升产生的推动作用。地区经济市场化进程的推进,市场经济的健康发展,对地区各生产要素(资本、劳动力、土地、技术等)按照市场经济规律的有效配置起到了决定性作用,并带动了各生产要素在比较优势中向城镇和非农产业的转移和聚集,从而提升地区的城镇化质量。因此,本文选用社会消费品零售总额(元)代表市场动力,同时为保证数据的平稳性,将社会消费品零售总额(元)取自然对数后作为解释变量(LnMARKET)。
-
本文进行的重庆市城镇化质量动力因素分析的样本原始数据均来源于《重庆统计年鉴》《重庆经济年鉴》及重庆市辖各区县统计公报。2011年重庆市进行了行政区划调整,撤销万盛区和綦江县,撤销双桥区和大足县,分别设立綦江区、大足区,由原来的40个区县变为现在的38个区县。本文综合考虑重庆市的现实情况,以样本和指标的代表性、连续性和可比性为原则,选取2007-2015年重庆市辖的36个区县(不包括綦江区、万盛经开区、大足区、双桥经开区)为样本。以2007-2015年重庆市36个样本区县的城镇化质量(Y)作为被解释变量,以取自然对数后的财政支出(LnGOV)、非农产业比重(INNER)、进出口总额(EXTER)、取自然对数后的社会消费品零售总额(LnMARKET)分别代表行政动力、内源动力、外源动力、市场动力作为解释变量,进行面板回归分析。样本变量的描述性统计如表 6所示。
-
面板数据是由截面数据和时间序列数据组合而成的,为避免可能存在因用非平稳时间序列数据建立回归模型而出现的虚假回归问题。本文对各变量指标的平稳性进行单位根检验。同时采用相同根单位根检验方法LLC和不同根单位根检验方法Fisher-ADF,来提高检验的准确性,各变量指标具体检验结果如表 7所示。由表 7可知,所有变量指标均在5%的显著性水平下通过LLC和ADF检验,即所有变量指标均平稳。
面板回归模型一般存在三种形式,即混合估计模型、变截距模型和变系数模型,通常采用F统计量进行检验确定。同时根据αi与解释变量的相关性,以上三种情况的模型又可分为固定效应模型和随机效应模型,一般采用Hausman检验进行判断确定。首先进行F统计量检验,经过Eviews 8.0软件处理,将面板回归三种模型进行面板最小二乘估计后的残差平方和S1、S2、S3代入如下公式(1)(2),计算出F1、F2,并与给定置信度下的相应临界值作比较来检验如下两个假设(H1,H2),其中N为模型中样本区县的个数,数值为36,T为时间跨度长,数值为9,K为模型中的参数估计个数,数值为4。
经过Excel 2013软件计算得出F2=5.644 9大于F0.01(175,144)=1.454 8,故拒绝原假设H2,不选择混合估计模型;F1=0.3461小于F0.01(140,144)=1.479 8,故接受原假设H1,使用变截距模型。继续使用Eviews 8.0软件进行Hausman检验,得出Hausman统计量值为17.556 806,对应的P值为0.001 5,故拒绝原假设,使用固定影响的变截距模型。因此,本文的数据回归模型为:
模型(3)中,i(i=1、2、…36)为重庆市某一样本区县;t(t=2007、2002、…2015)表示样本的观测年份;Yit为重庆市样本区县i在t时期的城镇化质量;LnGOVit为重庆市样本区县i在t时期的行政动力;INNERit为重庆市样本区县i在t时期的内源动力;EXTERit为重庆市样本区县i在t时期的外源动力;LnMARKETit为重庆市样本区县i在t时期的市场动力;c为模型的待估固定截距;αi为重庆市样本区县i的固定效应截距;β1、β2、β3、β4为各动力因素的待估系数;uit为随机干扰项。
-
经过Eviews 8.0软件处理,采用最小二乘法对模型(3)进行估计,得出模型的各参数估计结果(如表 8),样本区县固定效应αi的估计值(如表 9)。
根据模型的估计结果,得出重庆市城镇化质量动力因素面板回归模型的最终形式为:
首先,从模型估计结果的相关统计量分析模型估计的整体效果,在模型的拟合优度方面,无论是样本的决定系数(R-squared),还是修正后的决定系数(Adjusted R-squared)都在0.9以上,说明模型的估计值与实际值差距很小,模型的整体效果是可行的。在模型的所选解释变量对被解释变量的解释力度方面,F统计量(F-statistic)为92.102 7,其对应的P值为0.000 000,说明所有解释变量的整体显著性通过了F检验,即所选解释变量对被解释变量的解释效果是明显的。
其次,从模型估计的各参数估计结果分析模型各参数的作用效果。在各解释变量的显著性方面,解释变量LnGOV、INNER、EXTER、LnMARKET对应的P值均通过了0.05的显著性水平检验,说明本文选取的重庆市城镇化质量动力因素,即行政动力、内源动力、外源动力和市场动力对重庆市城镇化质量的影响是显著的。在各解释变量对重庆市城镇化质量的作用方面,解释变量的影响系数均为正值,说明本文选取的行政动力、内源动力、外源动力和市场动力对重庆市城镇化质量均起正向作用。其中,行政动力的影响系数为0.065 215,即财政支出每增加e元,重庆市城镇化质量就提升0.065 215个单位;内源动力的影响系数为0.254 277,即非农产业比重每增加一个百分点,重庆市城镇化质量就提升0.254 277个单位;外源动力的影响系数为0.021 617,即进出口总额占地区生产总值的比重每提高一个百分点,重庆市城镇化质量就提升0.021 617个单位;市场动力的影响系数为0.044 384,即社会消费品零售总额每增加e元,重庆市城镇化质量就提升0.044 384个单位。由各解释变量的影响系数值的大小可以看出,重庆市城镇化质量的动力因素(指标)的推动作用由大到小依次为内源动力(非农产业比重)、行政动力(财政支出)、市场动力(社会消费品零售总额)、外源动力(进出口总额占地区生产总值比重)。
最后,从模型估计结果中各样本区县的固定效应估计值,分析各样本区县的个体特征。样本区县的固定效应值αi表现出了样本区县间的差异,且样本区县的固定效应在不同的时期是保持不变的。从重庆市36个样本区县的固定效应估计值的αi取值可以看出,各样本区县的固定效应系数均不相同,差异明显。其中αi取值大于0的区县有15个区县,取值小于0的有21个区县,取值最大的为江北区,取值最小的为垫江县。固定效应系数αi取值排名前五名的区县为江北区、渝中区、南岸区、沙坪坝区、九龙坡区,集中于重庆市主城;排名后五名的区县为垫江县、奉节县、云阳县、酉阳县和秀山县分布于渝东南和渝东北地区;排名居于中间的样本区县分布于上述区域之间。
一. 变量选取说明
二. 样本选取说明
三. 模型的检验与构建
四. 模型运行结果分析
-
通过以上分析,可以得出:重庆市城镇化质量空间格局总体呈现出以重庆市主城各区,向临近主城区域,再向渝东南和渝东北地区逐级降低的空间格局特征;2007年至2015年重庆市城镇化质量各等级区域的均值均在增加,说明重庆市辖各区县城镇化质量整体提升;然而重庆市城镇化质量高等级和低等级区域包含区县数量占全部区县的比例由2007年的17.5%增加到2015年的31.58%,说明重庆市城镇化质量出现了两极分化的现象;在对重庆市城镇化质量动力因素的实证研究方面,变截距固定效应模型回归结果显示,本文验证的四大动力因素对重庆市城镇化质量的推动作用是显著的,且推动作用由大到小依次为内源动力(非农产业比重)、行政动力(财政支出)、市场动力(社会消费品零售总额)、外源动力(进出口总额占地区生产总值比重);重庆市36个样本区县的个体固定效应不同,差异明显。
基于以上研究结论,对提升重庆市城镇化质量提出以下几点对策建议:
第一,坚定新型城镇化道路,整体性提升城镇化质量。在对重庆市城镇化质量空间格局特征的分析中,城镇化质量呈现区域性等级差距,甚至两极分化的现象,说明重庆市城镇化发展存在不均衡。在中央对新型城镇化的发展提出进一步提高城镇化质量要求的背景下,重庆市应依托《国家新型城镇化规划(2014-2020年)》的总体部署,继续坚定不移地走新型城镇化道路,坚持以人为本,以新型工业化为动力,以统筹兼顾为原则,协调“大城市、大农村、大库区、大山区”并存特征的各区县城镇化发展,推动城市现代化、城市集群化、城市生态化,走科学发展、集约高效、功能完善、环境友好、社会和谐、城乡一体、协调发展的新型城镇化建设道路,才能避免城镇化进程中出现各区县发展不平衡甚至两极分化的现象,整体性地提升城镇化质量。
第二,加强生态文明建设,提升城镇生态环境质量。城镇是一个人口、经济、社会与自然环境耦合的系统。伴随着城镇规模和数量的扩大,也大幅度地改变了自然环境的组成和结构,带来了严重的环境污染和生态破坏的压力。重庆市城镇化质量低等级区域及低等级区域所含区县集中分布在渝东南和渝东北地区,说明在城镇化进程中,渝东南、渝东北地区未能充分利用自身生态环境优势提升城镇化质量。具体可从以下方面积极采取措施:坚持环境友好型和资源节约型的绿色城镇化发展战略,将生态文明理念融入城镇化建设中,在绩效考核中增加生态环境要素;积极发展循环经济,建立城镇内物质能量流动的循环网络,提高资源利用的生态效率,尽可能减少污染物的产生排放;加大环境治理的强度和环境保护的力度,建设高标准、高水平的与生态环境相关的基础设施,完善固体、液体、气体等废弃物的排放处理和环境监测与保护设施的建设,强化治理污染与环境保护的能力,使得具有生态环境优势的地区利用自身优势高效提升城镇化质量。
第三,优化产业结构,提高城镇化效率。城镇化发展需要高效率的发展路径,在新型城镇化进程中,重庆市应充分运用城镇化质量动力因素中推动力作用较大的内源动力(非农产业比重)、行政动力(财政支出),着力培养百亿级、千亿级的产业园区,重点发展技术密集型和资金密集型产业,提高特色优势产业、先进制造工业、高新技术产业、生产性服务业、绿色低碳产业以及品牌化产业的比重,推动城乡形成互促共进的经济技术联系,实现城乡产业的共生发展,促进城镇化质量进一步提升。
第四,充分考虑各区县实情,因地制宜实现城镇化质量均衡提升。重庆市辖各区县的个体固定效应不同,差异明显,说明在重庆市城镇化质量提升的过程中市辖各区县因自身区位、地理环境、社会、经济、人文等综合因素的不同而表现出明显的地区差异,城镇化质量呈现区域性等级差距,甚至两极分化的现象。针对区县功能定位不清晰、产业同质化严重、招商引资无序竞争、考核指标不够科学、资源配置亟待优化加强、生态环境急需保护等问题,需要统筹全市城镇体系建设,实施城镇化质量均衡提升的区域发展战略。重庆市辖各区县可以依据自身不同的优势,因地制宜地借助行政动力、内源动力、外源动力、市场动力等动力因素,实现城镇化质量的均衡提升。


 下载:
下载: