-
土壤温度作为表征土壤热力性质的重要参量,是陆面影响大气的主要因子,可通过影响地表能量分配、交换和水分收支来影响气候变化[1-3].它通过近地层与边界层逐渐作用到上层大气.因此在陆气相互作用中,土壤温度对大气环流和气候变化有重要影响[4].
青藏高原是世界上最高、地形最复杂的高原.南邻副热带,北至中纬度,平均海拔在4 000 m以上,是气候变化最为敏感的地区之一,也是研究全球气候、环境变化的关键和热点地区[5].其特殊的环境和气候条件引起的复杂陆气相互作用不仅在整个高原能量和水分循环过程中扮演重要角色,而且对我国,对亚洲,甚至对全球的大气环境和天气气候都有重要影响[6-9].因此,研究青藏高原土壤温度的变化特征尤为重要.
前人学者对此展开了丰富的研究.杨梅学等[10-12]利用GAME-Tibet所获得的资料得到藏北高原土壤温湿度的日变化、年变化、空间变化特征,分析发现季节的冻融过程及其空间分布对干湿季的转换和地表热量平衡的变化有重要作用.张娟等[13]指出在全球升温的背景下,对青藏高原高寒草甸生态系统进行土壤水热变化研究,有助于理解未来气候情景下植被、土壤和大气间能量交换,可为保护和恢复青藏高原高寒草甸生态系统提供依据.周玉淑等[14]揭示了青藏高原不同层次地温异常可能产生低频波,此波列的激发和传播可能影响长江中下游地区的降水.除此之外,也有不少学者通过数值模拟试验来研究土壤温度的变化特征.张世强等[15]和赵林等[16]对青藏高原地区土壤水热特征进行了模拟研究,但模拟研究对下垫面等方面考虑较多,模拟的结果与实测有一定差别.王澄海等[17-18]利用CoLM陆面模式对高原西部狮泉河站、改则站进行单点数值模拟试验,结果表明CoLM模式能较好地模拟高原陆面特征,对土壤温湿度和能量通量有一定的模拟能力.罗斯琼等[19-20]改进了CoLM模式中的土壤冻融过程参数化方案,并对高原玛曲站进行了模拟实验,发现改进后的方案对冻土水热过程的模拟能力有一定提高.陈渤黎等[21]利用CLM3.5对高原东北部边缘地区玛曲站进行单点数值模拟试验,对比地表能量、土壤温度、土壤湿度模拟值与观测值发现该模式在高原上的适用性良好,验证该模式对高原冻土地区有一定的模拟能力,为该模式的改进和发展提供了一定的参考依据.前人的研究不仅对参数化方案的选取,陆面模式的研究,而且对深入理解陆气相互作用的特征和机理都有重要意义.
青藏高原浅层地表土壤热状况作为连接多年冻土与大气的重要物理量,对于研究气候变化、高原热力效应以及高原多年冻土退化等方面都具有尤为重要的作用[22].但在青藏高原气候变化的研究中,人们的注意力主要集中在气温和地表温度等方面,对不同深度土壤温度的分析研究不多,特别是对整个青藏高原不同深度土壤温度的空间分布和时间演变规律的研究更少.因此,本研究在前人研究的基础上,对青藏高原近17年不同深度土壤温度的时空分布特征进行研究,为日后研究青藏高原的热力作用和陆气相互作用鉴定基础.
全文HTML
-
青藏高原由于其特殊的地理位置和复杂的地形,高原西部台站少,整个高原气象观测台站分布不均匀.观测资料的匮乏使得科学研究受到了很大的影响.随着再分析产品的不断完善,研究青藏高原的土壤温度也有了更为全面和精细化的气象数据,这为人们更好地认识青藏高原及全球气候变化提供可能.
本研究利用全球陆面数据同化系统(Global Land Data Assimilation System,GLDAS)Noah v2.1数据资料,时间分辨率为月,空间分辨率为0.25°×0.25°.资料选取的时间为:2000年1月-2016年12月.土壤温度共包括4层:0~10,10~40,40~100,100~200 cm.青藏高原主体范围选取为25°-40°N,70°-105°E.
GLDAS是由美国航空航天局(NASA)戈达德空间飞行中心(GSFC)、美国海洋和大气局(NOAA)国家环境预报中心(NCEP)联合开发的数据同化系统.该同化系统利用先进的地面模型与数据同化方法,根据地表观测与卫星遥感观测数据生成全球地表状态变量(如土壤湿度和土壤温度)和通量(如蒸发和感热通量)数据[23-24].其产品分为GLDAS-1和GLDAS-2两种. GLDAS-2采用普林休斯敦大学全球气象数据作为强迫场,且该数据集已经进行了统一的偏差矫正,数据在连续性上明显优于GLDAS-1,使用Noah陆面模式,模拟出1948-2010年的Noah2.0资料和2000年至今的Noah2.1资料. Wang[25]、刘川[26]和丁旭等[27]对比多套再分析资料在青藏高原上的适用性都发现GLDAS Noah地温产品适用性较好.
-
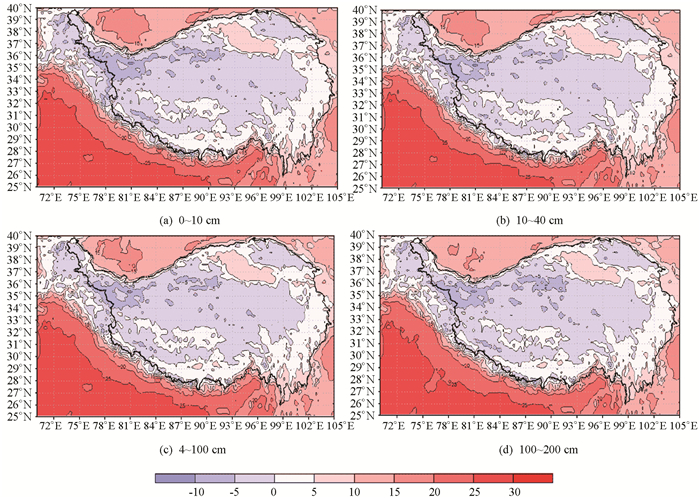
图 1为青藏高原0~10,10~40,40~100,100~200 cm平均土壤温度空间分布.可看出4层土壤温度空间分布相似,高原主体部位以及周边地区平均土壤温度约为-10~30 ℃.土壤温度与海拔和纬度成反比[28],高原地区土壤温度比周边地区普遍偏低,高原以南地区土壤温度比以北地区普遍偏高.高原主体部位土壤温度西部比东部冷,北部比南部冷.土壤温度从西北向东南方向形成弱的温度梯度.在高原西北部的昆仑山脉至阿里地区附近存在约为-10 ℃的冷中心.在高原东北部的柴达木盆地存在约为5 ℃的暖中心.高原东南部的雅鲁藏布江地区平均土壤温度均为正值,可能与其地势低且受西南暖湿气流的影响有关.高原边缘地区土壤温度等温线最密集,温度梯度最大,且南部边缘地区比北部边缘地区土壤温度梯度大.这可能和青藏高原南部地区多山脉,地形复杂有关.
-
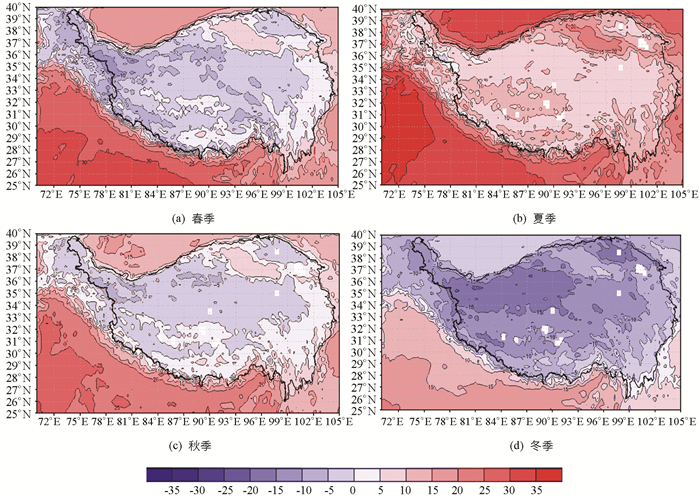
为了进一步了解各季节土壤温度空间分布特征,图 2给出青藏高原0~10 cm土壤温度四季平均空间分布图.其中四季的划分为:春季(3-5月)、夏季(6-8月)、秋季(9-11月)、冬季(12-次年2月).
春季(图 2a)和秋季(图 2c)土壤温度与平均土壤温度(图 1)空间分布十分相似,高原主体部位为弱的负值区,周边地区为弱的正值区.春季比秋季稍偏冷,春季土壤温度梯度稍偏大.两季闭合冷中心在昆仑山西段,春季为-10 ℃,秋季为-5 ℃.
夏季(图 2b)土壤温度最高,除了高原西部昆仑山西段和南部边缘地区有十分微弱的闭合冷中心之外,土壤温度均为正值.高原主体西南地区和柴达木盆地分别存在约为12.5 ℃和20 ℃的暖中心.
冬季(图 2d)土壤温度最低,且高原主体部位及其北方地区均为负值,南部地区为弱的正值区.昆仑山的闭合冷中心范围较春秋两季扩大,冷中心强度达-20 ℃左右.
10~40,40~100,100~200 cm土壤温度四季空间分布与图 2相似(图略).春季和夏季土壤温度随深度增加而降低,春季在昆仑山西段0~10 cm的冷中心随深度加深到100~200 cm,冷中心范围向右扩大了10个经度,但强度几乎不变.夏季变化比春季稍强,高原腹地0~10 cm暖中心随深度加深到100~200 cm,暖中心降低了10 ℃.秋冬季节土壤温度则随深度增加而升高,和春夏相反.秋季昆仑山地区0~10 cm的冷中心随深度加深到100~200 cm,升高了5 ℃.冬季则升高了10 ℃.
-
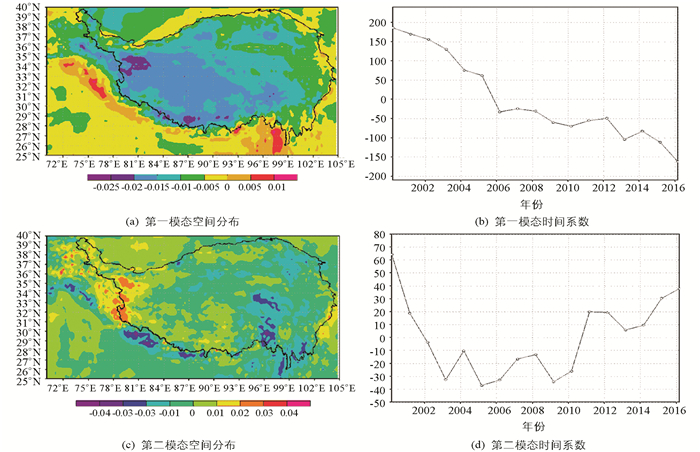
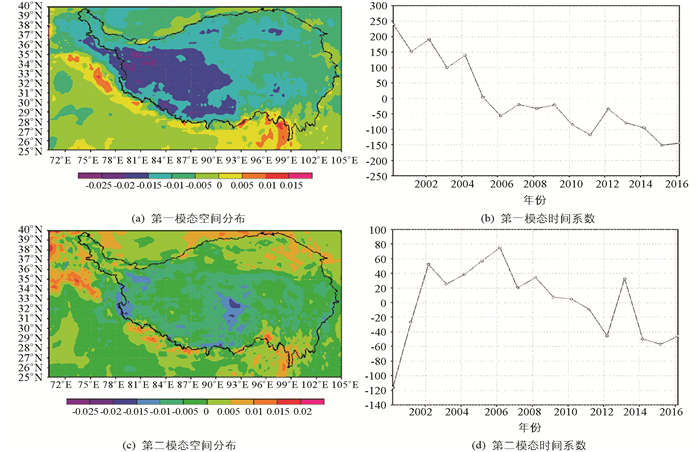
为了更细致地了解青藏高原土壤温度的空间分布特征,对青藏高原年平均土壤温度做EOF分析如图 3所示(因4层土壤温度EOF分析相似,选用0~10 cm为代表层进行分析).前两个模态累计方差贡献高达79%,其中第一模态71%,第二模态8%.说明土壤温度收敛速度极快.由图 3a发现高原主体部位表现为一致的负值区,极大负值中心分别位于阿里地区和珠穆朗玛峰附近.结合时间系数(图 3b)来看,表现出土壤温度逐年增温趋势.从第二模态(图 3c)可以看出青藏高原土壤温度东西反向变化,正值中心位于阿里地区,负值中心位于唐古拉山附近.这种反向变化在2000年最为显著. 2003年之后,这种反向变化呈现出不断增大趋势.
-
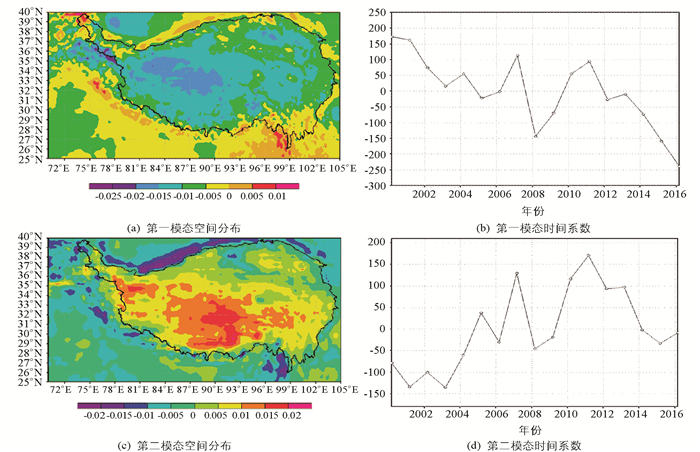
图 4为春季青藏高原土壤温度EOF分析结果,前两个模态累计方差贡献为67%,其中第一模态54%,第二模态13%,从图 4a可以看出春季和年平均相似,高原大部地区为一致的负值区,结合时间系数(图 4b)发现春季土壤温度逐年升温.从第二模态(图 4c)看出除高原西北部帕米尔高原、昆仑山西段以及高原北部边缘阿尔金山、祁连山等地区为负值区外,其余地区均为正值区,表现出弱的南北反向型. 2010年为此型态分布的突出贡献年.
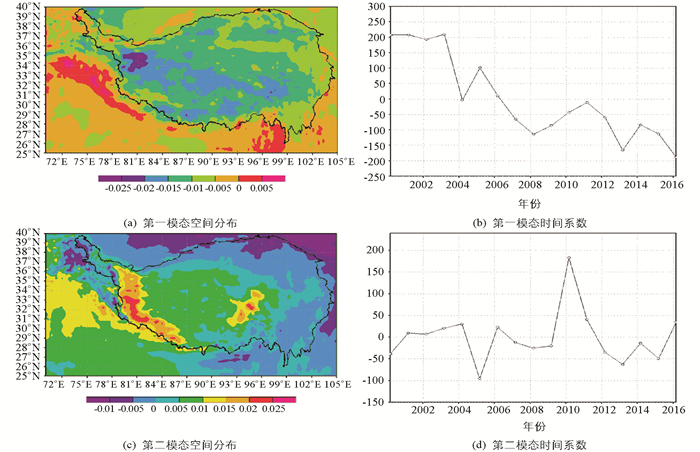
图 5为夏季青藏高原土壤温度EOF分析结果,前两个模态累计方差贡献为70%,其中第一模态59%,第二模态11%.第一模态(图 5a)表现出弱的全区一致负值区,结合时间系数(图 5b)表现出夏季土壤温度逐年升温.第二模态(图 5c)表现出帕米尔高原和青藏高原地区的东西反向变化,且时间系数(图 5d)表现出明显的“锯齿状”年际变化,2008年和2009年是连续的两年典型年.
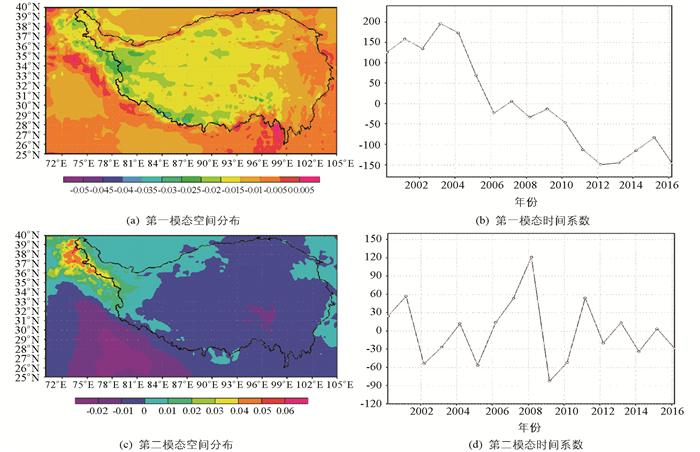
图 6为秋季青藏高原土壤温度EOF分析结果,前两个模态累计方差贡献为76%,其中第一模态65%,第二模态11%.第一模态(图 6a)表明秋季土壤温度呈整体一致型,且土壤温度随着年际变化不断上升.第二模态(图 6c)表现出土壤温度从北向南“+ - +”的变化特征.这种特征在2000年最为典型,时间系数从2000年起不断上升,2006年之后呈现不断减弱的趋势.
图 7为冬季青藏高原土壤温度EOF分析结果,前两个模态累计方差贡献为60%,其中第一模态35%,第二模态25%.冬季土壤温度的收敛速度比年平均以及其他3个季节的收敛速度都稍慢一些.从第一模态(图 7a)看出冬季土壤温度表现为全区一致性,结合时间系数(图 7b)发现土壤温度逐年上升,但升温趋势稍缓慢.第二模态(图 7c)表现出土壤温度在高原整体部位为正值区,在北部边缘地区呈现带状的负值区,土壤温度存在弱的南北反向分布.时间系数(图 7d)呈“山”字分布,2011年为典型年.
总的来看,无论是年平均还是四季平均EOF分析,高原土壤温度第一模态均表现出全区一致性,且土壤温度随着年际变化不断升温.年平均在阿里地区和唐古拉山地区表现出明显的东西反向变化特征.春季和夏季在帕米尔高原和高原主体部位表现出反相变化特征.除此之外,高原土壤温度还表现出较弱的南北反向、从北向南“+ - +”的变化特征.
2.1. 年平均土壤温度空间分布特征
2.2. 各季节平均土壤温度空间分布特征
2.3. 青藏高原土壤温度EOF分析
2.3.1. 年平均土壤温度EOF分析
2.3.2. 各季节平均土壤温度EOF分析
-
对4层土壤温度关于青藏高原主体范围(25°-40°N,70°-105°E)区域平均后得到逐年变化如图 8所示.可看出各层土壤温度均呈现出逐年增加趋势,且各层土壤温度逐年变化相关性极高,甚至达到0.99.这说明各层土壤温度之间有很好的一致性. 2005年之前土壤温度几乎呈现线性增加趋势,0~10 cm土壤温度最低,2005年之后土壤温度呈现波动变化,但仍为升温趋势. 100~200 cm土壤温度最低,10~40 cm土壤温度最高.说明浅层土壤增温趋势强于深层.结合表 1可得出相同结论. 2005年之后各层土壤温度均呈现出3次较为明显的高低温交替变化.土壤温度较高的年份有2006年、2009年、2010年和2013年.土壤温度较低年份有2007年、2008年、2011年、2012年和2014年. 2016年4层土壤温度均达到近17年最高值,各层土壤温度分别比平均土壤温度偏高1.3 ℃(0~10 cm),1.2 ℃(10~40 cm),1.1 ℃(40~100 cm)和0.9 ℃(100~200 cm).
-
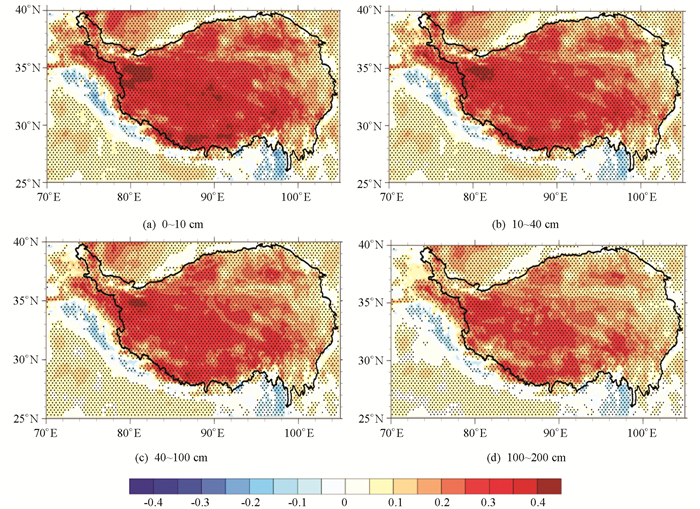
图 9为2000-2016年青藏高原土壤温度趋势系数空间分布图.可看出4层土壤温度趋势变化相似,均呈现不断增温趋势.且高原地区增温明显强于周边地区,高原主体部位西部增温强于东部.浅层增温趋势最强,越往深层,增温趋势越减弱.以0~10 cm为代表层分析发现高原大部地区土壤温度均以0.1至0.3 ℃/10a的速率增温,最大增温中心在阿里北部地区,数值高达0.67 ℃/10a.另外在喜马拉雅山脉一带南侧和缅甸地区存在弱的变冷趋势,约为-0.1至-0.2 ℃/10a.
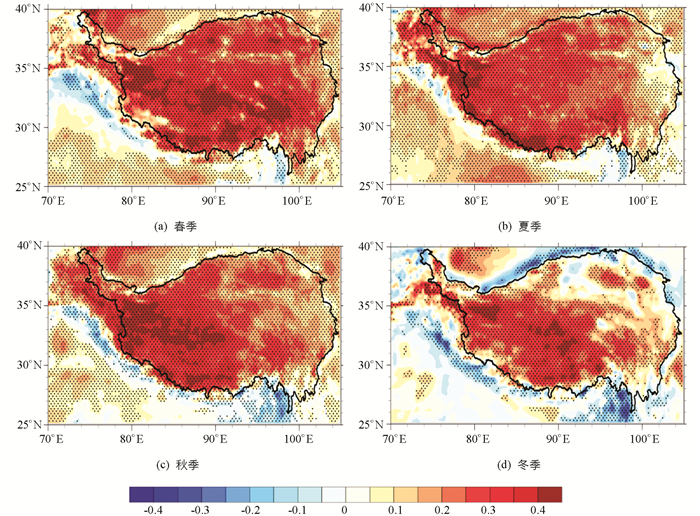
图 10为各季节0~10 cm土壤温度趋势系数空间分布图(因4层土壤温度趋势变化相似,选用0~10 cm为代表层进行分析).春季增温最强,秋夏次之,冬季最弱.其中春季增温南部强于北部.极大增温中心包括昆仑山脉、冈底斯山脉、唐古拉山脉、念青唐古拉山脉等藏北高地和南部的喜马拉雅山脉.最大增温速率可达1.3 ℃/10a.说明青藏高原增温中心与高大山地的地形特征有重要联系.
夏季和秋季增温趋势稍次于春季,且增温大值中心范围有所减小.夏季的增温大值中心主要包括阿里地区和南侧边缘喜马拉雅山脉地区,数值达0.73 ℃/10a.秋季增温大值中心主要包括藏北高原和藏南谷地地区,数值达0.69 ℃/10a.
冬季的增温趋势最弱,增温大值中心区域较其他3个季节明显缩小.在阿里地区和高原腹地中心区域有大值中心,最大增温速率为0.47 ℃/10a.
4个季节在喜马拉雅山脉一带南侧和缅甸地区均存在变冷趋势,且冬季最强,春秋次之,夏季最弱.和其他3个季节不同的是,冬季在高原北侧边缘也存在较强的变冷趋势带,最大强度达到了-0.43 ℃/10a.
3.1. 土壤温度年际变化特征
3.2. 土壤温度趋势变化空间分布
-
本研究使用了GLDAS-Noahv2.1陆面模式资料,分析2000-2016年青藏高原土壤温度的变化特征,得出以下结论:
1) 青藏高原土壤温度空间分布与纬度和海拔成反比,高原主体比周边地区冷,北部比南部冷.高原边缘地区土壤温度梯度最大.夏季土壤温度最暖,冬季最冷.
2) 夏季浅层土壤温度高于深层土壤温度,土壤温度梯度垂直向下,热量向下输送.冬季则刚好相反,浅层土壤温度低于深层土壤温度,土壤温度梯度垂直向上,热量向上输送.
3) EOF分析发现年平均和四季土壤温度第一模态均表现出全区一致型,且逐年升温.年平均土壤温度在阿里地区和唐古拉山地区表现出明显的东西反向变化特征.
4) 各层土壤温度变化相似且均呈现不断增温的趋势.越往浅层,土壤温度增温趋势越明显.土壤温度趋势变化发现4层增温趋势相似,高原地区增温趋势强于周边地区,西部增温强于东部,浅层增温强于深层.


 下载:
下载:
