-
大数据时代已经到来,“数据”贯穿了生活的方方面面,在各行各业中都起着举足轻重的作用. 各个领域为了挖掘潜藏的数据价值,对已有数据进行分析建模,但同时也面临着真实场景过于复杂,易出现高维数据的情况. 在变量维数p远大于样本量n的情况下,传统低维统计分析方法往往显得力不从心. 首先模型的准确性难以得到保证,其次在解释变量大量增加的情况下,模型对于问题的可解释性变差,分析的焦点被模糊,并且在高维变量情况下,模型的复杂度提高,计算量增加,存在一定的求解困难. 因此,在建模过程中,变量选择显得尤为重要.
高维数据变量选择最常用的方法是基于罚函数的正则化方法[1],它可以同时进行变量选择和参数估计. 稀疏正则化方法的一般框架为
其中:l(β)为损失函数,pλ(·)为罚函数,λ为正则化参数. 常用的正则化方法有Lasso[2],adaptive Lasso[3],relaxed Lasso[4],SCAD[5],MCP[6]等. 在实际应用中,上述方法的正则化参数λ的调节是非常重要的,正则化参数λ的选择决定了模型的性能. 目前常采用CV(交叉验证)[7],GCV(广义交叉验证)[8],AIC(赤池信息准则)[9],BIC(贝叶斯信息准则)[8]等多种准则选择正则化参数λ,但是每种方法都有各自的优缺点. CV方法的预测误差小,但计算量庞大,而且没有完整理论推导,且解释性较差. GCV方法容易产生过拟合现象[8],从而不满足变量选择的一致性要求. AIC准则可以权衡估计模型的复杂度和模型拟合数据的优良性,但也易出现过拟合现象. BIC准则选择的模型更加接近于真实模型,但是它只考虑了变量选择,参数估计的效果不一定好. Hansen[10]针对岭回归问题提出最优化参数选择的L曲线法. L曲线方法简单易行,不受模型误差方差的影响,但L曲线方法不一定适用于Lasso正则化参数的选择.
鉴于以上原因,本文运用L曲线的思想,提出一种新的L曲线准则(LC)选择Lasso正则化参数. 通过数值模拟,比较CV,GCV,BIC与LC在Lasso方法中模型选择和参数估计的效果. 最后将该方法运用在实际数据中,分析探讨2019年186个国家经济自由指数的影响因素.
全文HTML
-
考虑线性模型:
其中:y=(y1,y2,…,yn)T为响应变量;X=[x1,x2,…,xp]∈
$\mathbb{R}^{n \times p}$ 为解释变量所组成的样本数据,xj=(x1j,x2j,…,xnj)T,j=1,2,…,p为解释变量;β=(β1,β2,…,βp)T为线性方程的回归系数;ε=(ε1,ε2,…,εn)T为随机误差,并且εi服从均值为0,方差为1的独立同分布.1996年,文献[2]提出了Lasso方法,通过对回归系数的L1范数进行惩罚来压缩回归系数,并使绝对值较小的回归系数被自动压缩为0,从而同时实现参数估计和变量选择,基于线性回归的Lasso模型为
其中:λ≥0为正则化参数,‖·‖2表示L2范数,
$\|\beta\|_{1}=\sum\limits_{p=1}^{p}\left|\beta_{p}\right|$ 为L1范数. Lasso正则化方法对应的优化问题是凸优化问题,具有稀疏解. -
正则化参数λ的选择决定了模型的性能,因此参数λ的选择至关重要. 目前Lasso方法常通过CV,GCV,AIC,BIC等多种方法来确定参数.
1) CV方法是一种无假设,可以直接进行参数估计的变量选择的方法. 其思想是在给定样本中,拿出大部分样本进行建模(训练集),留小部分样本用建立的模型进行预测(测试集),并计算小部分样本的预测误差,记录误差平方和. 它的优点是预测误差小,但是计算量庞大,而且没有完整的理论依据推导,解释性较差. CV方法的公式如下:
2) GCV计算过程简单,GCV具体形式为
其中
$\widehat f$ 是由下式给出的广义自由度:且
$\sum \lambda=\operatorname{diag}\left\{\frac{\boldsymbol{p}_{\lambda}^{\prime}\left(\left|\hat{\boldsymbol{\beta}}_{1}\right|\right)}{\left|\hat{\boldsymbol{\beta}}_{1}\right|}, \cdots, \frac{\boldsymbol{p}_{\lambda}^{\prime}\left(\left|\hat{\boldsymbol{\beta}}_{p}\right|\right)}{\left|\hat{\boldsymbol{\beta}}_{p}\right|}\right\} \cdot \sum \lambda$ 的对角元素是罚函数pλ(·)的局部二次逼近中的二次项系数.但文献[8]指出GCV方法容易产生过拟合现象,即在参数选择时,λ容易过小,则非零β数量就会过多,造成模型的过拟合,从而不满足变量选择的一致性要求.
3) 基于BIC准则的正则化参数选择大致对应于在适当的贝叶斯公式中最大化选择真实模型的后验概率,BIC准则定义如下:
理论上已经证明BIC准则满足模型选择的一致性要求,由BIC准则选择的模型更加接近于真实模型,但是它只考虑了变量选择,参数估计的效果不一定好. 在高维情形下的BIC准则可见文献[10].
1.1. Lasso估计
1.2. 参数选择方法
-
岭回归模型[11]为:
其中λ≥0为正则化参数. 岭估计的罚函数是L2范数,不能把系数压缩到零,因此不能产生稀疏解. 岭参数的选择会在很大程度上影响估计的结果.
文献[12]提出了一种新方法,通过观察由点构成的曲线确定岭回归中的岭参数. 其中横坐标为λi(i=1,…,l,l表示预先给定的个数)点处的损失函数‖y-Xβ‖22的对数值,纵坐标表示λi点处的罚函数值‖β‖22的对数值. 通过奇异值分解方法分析了该曲线的所有性质,并指出该曲线上曲率最大的点对应的正则化参数λi即为最优正则化参数,曲率最大的点记为L-corner. 由于曲线呈现为L形,因此Hansen将这种由残差范数和解范数为坐标点构成的曲线来寻找最优正则化参数的方法称之为L曲线准则. 文献[13]讨论了是否对横纵坐标取对数. 文献[14]介绍了L-corner的数值解法,当选择的正则化方法的正则化参数连续变动时,由残差范数和解范数为坐标构成的L曲线是光滑的,可能是二次可微的,那么L-corner就位于L曲线曲率κ(λ)最大处,L-corner处对应的λ0即是最优正则化参数的值. 曲率κ(λ)计算公式[14]为:
其中:ρ表示残差范数,η表示解范数,′表示对参数λ求导.
-
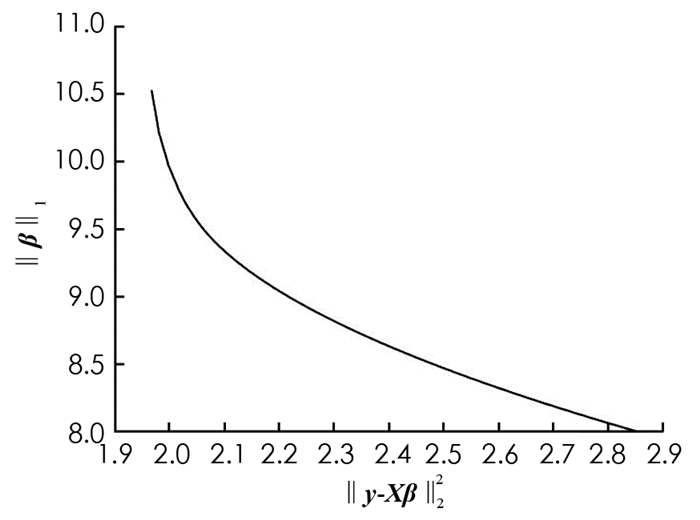
本文试运用L曲线准则在Lasso方法中确定最优正则化参数. 考虑最优化问题(3),构造以(‖y-Xβ‖22,‖β‖1)为坐标点的曲线,其中横坐标为λi点处的损失函数‖y-Xβ‖22的值,纵坐标表示λi点处的罚函数值‖β‖1的值. 找出该曲线的L-corner,该点的正则化参数λi即为最优参数. 但通过多组不同的数据进行仿真模拟,以(‖y-Xβ‖22,‖β‖1)为坐标点绘制曲线,发现不容易找到曲线拐点(图 1). 因此可以认为,对于Lasso正则化方法而言,L曲线准则不容易找出最优的正则化参数λ0.
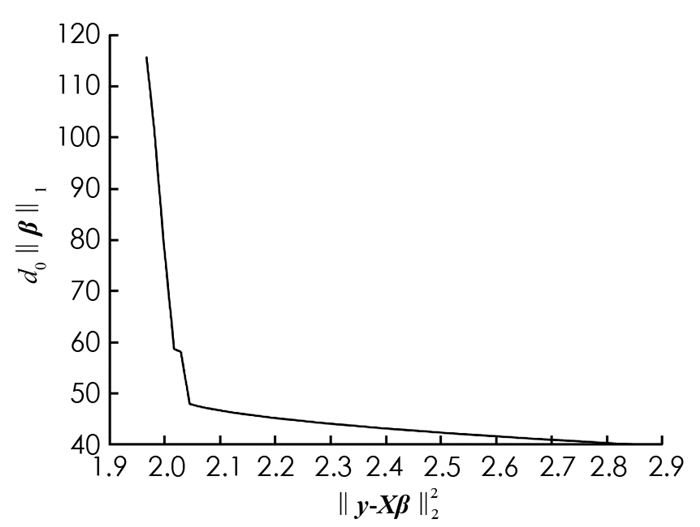
鉴于此,本文提出一种适合Lasso正则化参数选择的新L曲线准则. 所谓L曲线准则,是指由坐标为(‖y-Xβ‖22,d0·‖β‖1)的点构成的光滑曲线,每一个坐标点对应一个正则化参数λi,其中d0表示Lasso估计中非零参数的个数. 值得注意的是,以(‖y-Xβ‖22,d0·‖β‖1)为坐标的点构成的光滑曲线为L形状(图 2). 当‖y-Xβ‖22与d0·‖β‖1同时取得最小值(曲率最大)时的点即为L-corner,对应的λ0即为最优正则化参数. L-corner的数值解法与岭回归中L曲线准则相同,详情见文献[14],此处不再阐述.
2.1. 岭回归中的L曲线准则
2.2. Lasso中的L曲线准则
-
本节通过数值模拟,来比较在CV,GCV,BIC,LC下通过Lasso正则化方法进行变量选择以及参数估计.
考虑线性模型(2),取σ=1,2,样本与变量数分别取n=100,200,p=12,20,200,500形成多组随机模拟数据,且β=(3,1,5,0,0,2,0,0,…)1×pT,xi和xj之间的相关系数为cor(j1,j2)=0.5|j1-j2|. 在算法上,Lasso估计采用ADMM算法[15],分别通过CV,GCV,BIC,LC选择正则化参数. 重复进行100次模拟实验,模拟结果如表 1(低维情形)和表 2(高维情形)所示.
为比较估计精确性,需计算模型误差
通过多次的重复试验,用以下指标来评价不同参数选择方法下Lasso估计的模型性能. “MME”表示模型误差ME的中位数;“SD”表示模型误差ME的标准差;“C”表示100次重复实验中非零系数被正确估计为非零个数的均值;“IC”表示100次重复实验中零系数被错误估计为非零个数的均值;“Underfit”表示欠拟合,即在100次模拟实验中将非零系数错误估计为零的比例;“Correctfit”表示正确拟合,即在100次模拟实验中将非零系数正确估计为非零的比例;“Overfit”表示过拟合,即100次模拟实验中选择了所有重要变量并且包含了非零系数的比例.
表 1和表 2分别展示了低维数据和高维数据两种情况,在不同的随机误差水平下,运用多种变量选择的方法进行Lasso估计. 从参数估计误差角度来看,Lasso估计在LC准则下误差比CV方法选择的模型误差小,但是比BIC准则选择的模型误差大,即Lasso估计在LC准则下参数估计的效果介于CV方法和BIC准则之间. 从模型的稀疏性角度来看,Lasso估计在LC准则下选择模型较CV,GCV,BIC具有更高的正确拟合比例,具有更低的过拟合比例,即LC准则下的Lasso估计能够选择较稀疏的模型. 从变量选择的一致性角度来看,Lasso估计在LC准则下的系数估计效果比CV,GCV,BIC都好,即LC准则下Lasso估计所选择的变量的一致性较好.
-
本节在kaggle平台下载2019年世界186个国家的经济自由指数的相关数据,该数据集共有13个变量,涵盖186个国家的12项自由指标,从财产权到财务自由,分别为:财产权X1;司法效力X2;政府诚信X3;税收负担X4;政府支出X5;财政健康X6;商业自由X7;劳工自由X8;货币自由X9;贸易自由X10;投资自由X11;财务自由X12;经济自由指数Y. 对数据进行缺失值和异常值处理,剩下173个国家的样本数据. 把经济自由指数作为响应变量,其余12个变量作为解释变量,进行实例分析建模.
通过分析,从表 3可以看出,经济自由指数与其余各因素呈现较强的线性关系,即有线性模型:
其中:yi表示第i个国家的经济自由指数(得分),xij为第i个国家的第j个变量,εi是均值为0,方差为σ2的随机误差项.
利用OLS(最小二乘估计),CV,GCV,BIC和LC下的Lasso估计对该数据进行分析. 变量选择结果如表 4所示. 从变量选择的数量来看,最小二乘估计(OLS) 选择了所有的变量,CV下的Lasso罚估计也选择了全部12个变量,没有达到变量选择的目的;GCV和BIC准则下的Lasso估计分别选择了11个和12个变量;通过LC准则的Lasso罚估计选择了3个重要变量,分别为X3,X4,X5,模型也更为稀疏.
3.1. 数值模拟
3.2. 实例分析
-
本文讨论了Lasso正则化方法在变量选择和参数估计中的应用,针对Lasso正则化提出了LC准则,从而更好地确定在不同数据情况下的最优正则化参数. 数据模拟和实际应用的结果都表明,Lasso估计在LC准则下能够选择较稀疏的模型,且有较高的概率选择与真实情况相吻合的模型,模型选择效果好. 另外LC准则下的模型的误差较小,参数估计效果好. 本文的LC准则同样可以推广到非线性模型中.


 下载:
下载:
