Message Board

Dear readers, authors and reviewers,you can add a message on this page. We will reply to you as soon as possible!

2023 Volume 48 Issue 7
Article Contents

LUO Xinyi, PENG Zuoxiang. Distributed Moment Ratio Estimator for Extreme Value Index[J]. Journal of Southwest China Normal University(Natural Science Edition), 2023, 48(7): 67-72. doi: 10.13718/j.cnki.xsxb.2023.07.010
Citation: LUO Xinyi, PENG Zuoxiang. Distributed Moment Ratio Estimator for Extreme Value Index[J]. Journal of Southwest China Normal University(Natural Science Edition), 2023, 48(7): 67-72. doi: 10.13718/j.cnki.xsxb.2023.07.010

Distributed Moment Ratio Estimator for Extreme Value Index

More Information
  • Corresponding author: PENG Zuoxiang
  • Received Date: 05/09/2022
    Available Online: 20/07/2023
  • MSC: O211.3

  • Based on a divide-and-conquer algorithm and the moment ratio estimator, we proposed a distributed moment ratio estimator and prove its consistency and asymptotic normality.

  • 加载中
  • [1] HILL B M. A Simple General Approach to Inference about the Tail of a Distribution [J]. The Annals of Statistics, 1975, 3(5): 1163-1174.

    Google Scholar

    [2] MASON D M. Laws of Large Numbers for Sums of Extreme Values [J]. The Annals of Probability, 1982, 0(3): 754-764.

    Google Scholar

    [3] DAVIS R, RESNICK S. Tail Estimates Motivated by Extreme Value Theory [J]. The Annals of Statistics, 1984, 12(4): 1467-1487.

    Google Scholar

    [4] GOLDIE C M, SMITH R L. Slow Variation with Remainder: Theory and Applications [J]. The Quarterly Journal of Mathematics, 1987, 38(1): 45-71. doi: 10.1093/qmath/38.1.45

    CrossRef Google Scholar

    [5] GOMES M I, MARTINS M J, NEVES M. Alternatives to a Semi-Parametric Estimator of Parameters of Rare Events—The Jackknife Methodology[J]. Extremes, 2000, 3(3): 207-229. doi: 10.1023/A:1011470010228

    CrossRef Google Scholar

    [6] GOMESA M I, MARTINS M J. "Asymptotically Unbiased" Estimators of the Tail Index Based on External Estimation of the Second Order Parameter [J]. Extremes, 2002, 5(1): 5-31. doi: 10.1023/A:1020925908039

    CrossRef Google Scholar

    [7] DE HAAN L, PENG L. Comparison of Tail Index Estimators [J]. Statistica Neerlandica, 1998, 52(1): 60-70. doi: 10.1111/1467-9574.00068

    CrossRef Google Scholar

    [8] PENG L. Asymptotically Unbiased Estimators for the Extreme-Value Index [J]. Statistics & Probability Letters, 1998, 38(2): 107-115.

    Google Scholar

    [9] GOMES M I, MARTINS M J. Bias Reduction and Explicit Semi-Parametric Estimation of the Tail Index [J]. Journal of Statistical Planning and Inference, 2004, 124(2): 361-378. doi: 10.1016/S0378-3758(03)00205-2

    CrossRef Google Scholar

    [10] IVETTE GOMES M, DE HAAN L, RODRIGUES L H. Tail Index Estimation for Heavy-Tailed Models: Accommodation of Bias in Weighted Log-Excesses [J]. Journal of the Royal Statistical Society: Series B (Statistical Methodology), 2008, 70(1): 31-52. doi: 10.1111/j.1467-9868.2007.00620.x

    CrossRef Google Scholar

    [11] DAVYDOV Y, PAULAUSKAS V, RAČKAUSKAS A. More on P-Stable Convex Sets in Banach Spaces [J]. Journal of Theoretical Probability, 2000, 13(1): 39-64. doi: 10.1023/A:1007726708227

    CrossRef Google Scholar

    [12] PAULAUSKAS V. A New Estimator for a Tail Index [J]. Acta Applicandae Mathematica, 2003, 79(1): 55-67.

    Google Scholar

    [13] CHEN L J, LI D Y, ZHOU C. Distributed Inference for the Extreme Value Index [J]. Biometrika, 2022, 109(1): 257-264. doi: 10.1093/biomet/asab001

    CrossRef Google Scholar

    [14] DE HAAN L, FERREIRA A. Extreme Value Theory [M]. New York: Springer New York, 2006.

    Google Scholar

    [15] DEKKERS A L M, EINMAHL J H J, DE HAAN L. A Moment Estimator for the Index of an Extreme-Value Distribution [J]. The Annals of Statistics, 1989, 17(4): 1833-1855.

    Google Scholar

  • 加载中
通讯作者: 陈斌, bchen63@163.com
  • 1. 

    沈阳化工大学材料科学与工程学院 沈阳 110142

  1. 本站搜索
  2. 百度学术搜索
  3. 万方数据库搜索
  4. CNKI搜索

Figures(1)

Article Metrics

Article views(205) PDF downloads(49) Cited by(0)

Access History

Other Articles By Authors

Distributed Moment Ratio Estimator for Extreme Value Index

    Corresponding author: PENG Zuoxiang

Abstract: 

Based on a divide-and-conquer algorithm and the moment ratio estimator, we proposed a distributed moment ratio estimator and prove its consistency and asymptotic normality.

  • 设{Xnn≥1}为独立同分布的随机变量序列,其公共分布函数为F(x). 若存在常数an>0,bn$ \mathbb{R}$使得对所有1+γx>0,有

    其中$G_\gamma(x)=\exp \left\{-\left(1+\gamma_x\right)^{-\frac{1}{\gamma}}\right\}, \gamma \in \mathbb{R} $,则称F属于极值分布Gγ的吸引场,记为FD(Gγ),γ为极值指数. 当γ>0时,(1)式等价于

    其中$U(t)=\frac{1}{(1-F)^{\leftarrow}(t)} $.

    当分布函数F未知时,对极值指数γ的估计是极值理论的一个重要组成部分,受到了学者的广泛关注,常用于金融、保险、自然灾害等领域. 在分布函数形式未知的情况下,文献[1]提出了著名的Hill估计量,推断分布函数的尾部表现;文献[2-4]在一定条件下证明了Hill估计量的相合性和渐近正态性;文献[5]提出了矩率估计量,并给出了其分布表示;文献[6]提出了一系列基于二阶参数的外部估计得到的渐近无偏估计量,并证明了其渐近性质;文献[7]证明了包含Hill估计量和矩率估计量在内的一系列尾指数估计量的渐近正态性. 关于尾指数估计量的更多研究,见文献[8-10].

    在大数据时代,估计极值指数时,常常会遇到被分开存储的数据,例如分析来自不同保险公司的保险索赔时,为了保护客户的隐私,保险公司不能向外部分享具体的数据,甚至不能分享任何索赔结果,此时前文所提的Hill估计量和矩率估计量等都不可用. 与大部分尾指数估计量的相关文献一样,Hill估计量等只使用了一部分秩序较高的统计量. 文献[11]和文献[12]基于块方法提出了DPR估计量. 当数据被分组储存且每组只有少数几个最大的样本可用于分析时,DPR方法是可行的,但是它仅使用了每块中最大的两个样本,很可能并不是尾指数的充分统计量.

    而分治算法可以分析存储在多台计算机中的数据集,分别估计每台机器上的参数,并将结果发送到中央机器. 中央机器通过简单的平均来结合所有结果,以获得计算可行的估计量. 设独立同分布的样本X1X2,…,Xn存储在k个机器中,每个机器存储m个观测,令Mj(1)Mj(2)≥…≥Mj(m)表示存储在机器j内的样本次序统计量,文献[13]基于Hill估计量提出如下分布式Hill估计量

    其中,d为一个确定的整数,表示每个机器所使用的超过门限值的个数. $\hat{\gamma}_{\mathrm{DH}} $是极值指数的一个相合估计量,且在二阶正规变换条件下具有渐近正态性.

    受文献[13]启发,本文基于矩率估计量提出如下分布式矩率估计量

    并研究其相合性和渐近正态性,中间序列k=k(n)满足当n →∞时,

    为了证明其渐近正态性,我们需要文献[14]中的二阶条件,即存在一个最终或正或负的函数A,且$ \lim\limits _{t \rightarrow \infty} A(t)=0$,和一个实数ρ≤0,使得

1.   相合性和渐近正态性
  • 定理1   假设(2)式及(5)式成立. 当n→∞时,$\hat{\gamma}_{\mathrm{DMR}} \stackrel{P}{\longrightarrow} \gamma $.

    定理2    假设(5)式及(6)式成立. 当n→∞时,若$ (k d)^{\frac{1}{2}} A\left(\frac{m}{d}\right)=O(1)$成立,则

    其中

2.   定理的证明
  • 设独立同分布的样本X1X2,…,Xn存储在k个机器中,每个机器存储m个观测,令Mj(1)Mj(2)≥…≥ Mj(m)表示存储在机器j内的样本次序统计量. Zj(1)≥…≥Zj(m)表示对应于Mj(1)≥…≥Mj(m)的服从Pareto(1)分布的次序统计量,则由文献[14]知$ \left\{M_j^{(i)}\right\}_{i=1}^m \stackrel{d}{=}\left\{U\left(Z_j^{(i)}\right)\right\}_{i=1}^m$.

    定理1的证明   由文献[14]的定理B.1.9知,对x>1和tt0有,

    tx=Zj(i)t=Zj(d+1),由(8)式和(9)式知

    由(10)式和(11)式可得

    由文献[15]的引理3.4知

    其中{Ej(i),i=1,…,d}服从独立同分布的标准指数分布,j=1,…,k. 因此

    将(13)式及(14)式代入不等式(12)即可得$\hat{\gamma}_{\mathrm{DMR}} \stackrel{P}{\longrightarrow} \gamma $,定理证毕.

    对定理2的证明,我们需要下面这个辅助引理.

    引理1    令Z(1)≥…≥Z(m)表示服从Pareto(1)分布的独立随机变量{Z1,…,Zm}的次序统计量,则对任意ρ≤0,有

    其中g(dmρ)的定义见(2)式. 并且,当m→∞时,

       见文献[13]的引理S.3.

    定理2的证明  由文献[14]的定理B.2.18知,存在一个函数A0(t),使得当t→∞时,A0(t)~A(t),且对所有ε>0,δ>0,存在一个t0>0使得对txt0tt0

    定义$\mathscr{S}_{n, d, t_0}=\left\{Z_j^{(d+1)} \geqslant t_0, 1 \leqslant j \leqslant k\right\} $,由文献[13]的引理S.2知,对任意t0>0,$ \lim\limits _{n \rightarrow \infty} \mathrm{P}\left(\mathscr{S}_{n, d, t_0}\right)=1$. 所以,基于集合$ \mathscr{I}_{n, d, t_0}$,我们用$ \frac{m}{d}$Zj(i)i=1,2,…,d+1替换不等式(15)中的ttx,得到

    ii=d+1应用两次不等式(16),当n→∞时,

    ρ < 0,存在δ>0使得ρ+δ < 0,应用不等式

    可以得到

    与定理1的证明类似,我们可以得到当n→∞时,$ I_1 \stackrel{d}{\longrightarrow} N\left(0, 2 \gamma^2\right)$.

    对于I2,记

    由弱大数定律可知,当n→∞时,

    由引理1知,当m→∞时,

    结合$ (k d)^{\frac{1}{2}} A\left(\frac{m}{d}\right)=O(1)$的假设可以得到,当n→∞时,$I_2=\frac{2-\rho}{1-\rho}(k d)^{\frac{1}{2}} A_0\left(\frac{m}{d}\right) g(d, m, \rho)+o_p(1) $. 类似地可以得到$I_3=-(k d)^{\frac{1}{2}} A_0\left(\frac{m}{d}\right) g(d, m, \rho)+o_p(1) $. 故$I_2+I_3=\frac{1}{1-\rho}(k d)^{\frac{1}{2}} A_0\left(\frac{m}{d}\right) g(d, m, \rho)+ o_p(1)$.

    I2的计算类似,可以得到$I_4 \stackrel{P}{\longrightarrow} 0, I_5 \stackrel{P}{\longrightarrow} 0 $.

    综上,当n→∞时,$(k d)^{\frac{1}{2}}\left\{\hat{\gamma}_{\mathrm{DMR}}-\gamma-(1-\rho)^{-1} A\left(\frac{m}{d}\right) g(d, m, \rho)\right\} \stackrel{d}{\longrightarrow} N\left(0, 2 \gamma^2\right) $ρ < 0时的结论得证.

    对于ρ=0,(16)式等价于当n→∞时,

    其后的证明方法与ρ < 0的情况类似,此处省略,定理证毕.

3.   模拟研究
  • 本文提出了分布式矩率估计量,下面将其与分布式Hill估计量进行有限样本表现的比较. 以γ=1,ρ=-1,机器数量一定时,Burr分布的表现为例,其分布函数为F(x)=1-(1+x)-1. 随机生成n个来自Burr分布的样本,存储在k个机器中,每个机器有m个观测,对每一个机器,从m个观测中选取d个超过数(d为自变量),分别计算分布式Hill估计量和分布式矩率估计量的估计均值和均方误差,每个实验重复s次并取平均值.

    设置n=1 000,k=20,m=50,s=100,d的取值范围为1,…,30,模拟结果如图 1所示.
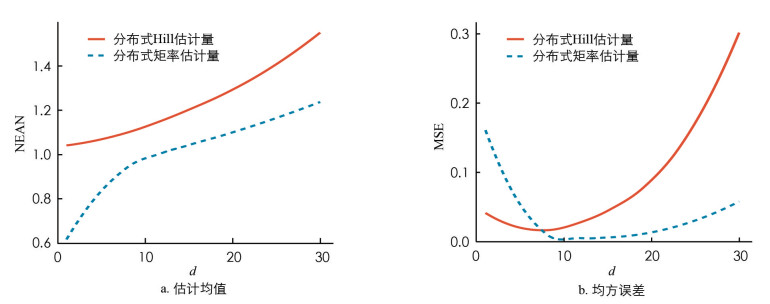
    图 1可知,当k一定时,在γ=1,ρ=-1的Burr分布下,随着d的增加,$\hat{\gamma}_{\mathrm{DH}} $$\hat{\gamma}_{\mathrm{DMR}} $的均值都存在上升的趋势,但当d较大时,$\hat{\gamma}_{\mathrm{DMR}} $的均值更接近真实值;同时,$\hat{\gamma}_{\mathrm{DH}} $$\hat{\gamma}_{\mathrm{DMR}} $的均方误差随着d的增加先下降后上升,并且当d较大时,$\hat{\gamma}_{\mathrm{DMR}} $的均方误差低于$\hat{\gamma}_{\mathrm{DH}} $的均方误差,表现更为稳定. 因此,在最小均方误差准则下,当d较大时,$\hat{\gamma}_{\mathrm{DMR}} $的估计效果明显优于$\hat{\gamma}_{\mathrm{DH}} $.

Figure (1)  Reference (15)

Catalog

    /

    DownLoad:  Full-Size Img  PowerPoint
    Return
    Return